Logstash是一個(gè)完全開(kāi)源的工具,他可以對(duì)你的日志進(jìn)行收集、分析,并將其存儲(chǔ)供以后使用(如,搜索),您可以使用它。說(shuō)到搜索,logstash帶有一個(gè)web界面,搜索和展示所有日志。
kibana 也是一個(gè)開(kāi)源和免費(fèi)的工具,他可以幫助您匯總、分析和搜索重要數(shù)據(jù)日志并提供友好的web界面。他可以為 Logstash 和 ElasticSearch 提供的日志分析的 Web 界面
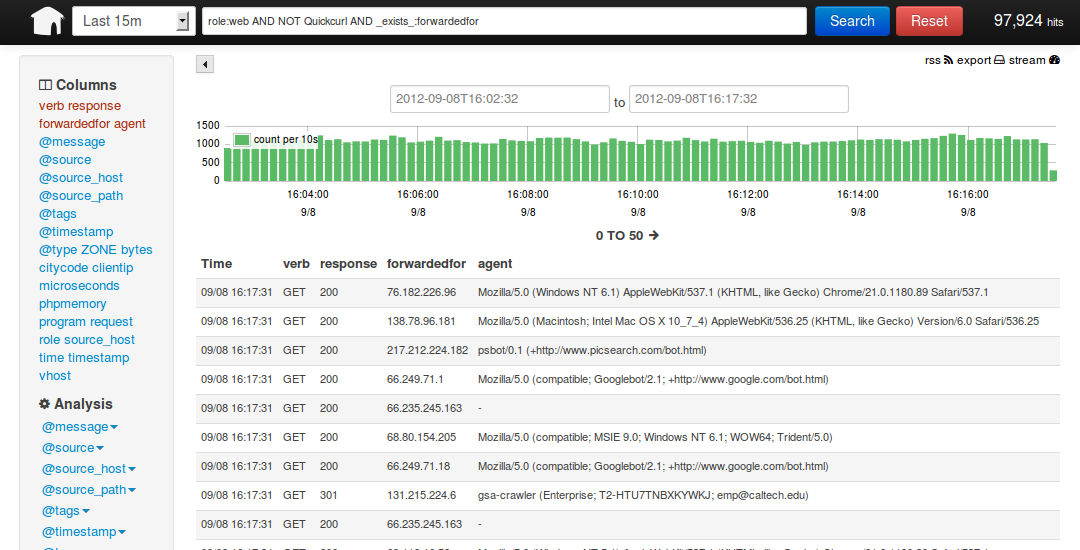
說(shuō)到這里,我們看看 kibana 和 logstash到底能為我們做些什么呢?下面是kibana的界面
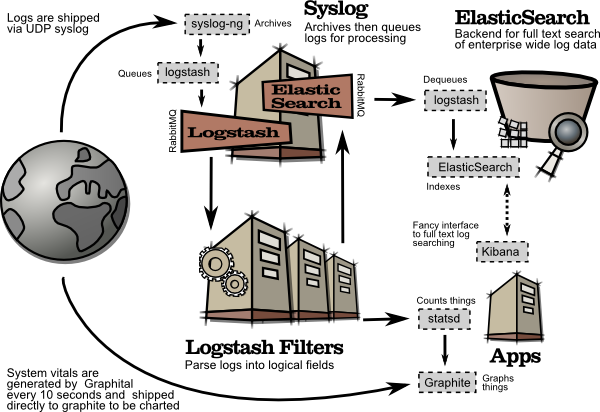
簡(jiǎn)單來(lái)講他具體的工作流程就是 logstash agent 監(jiān)控并過(guò)濾日志,將過(guò)濾后的日志內(nèi)容發(fā)給redis(這里的redis只處理隊(duì)列不做存儲(chǔ)),logstash index將日志收集在一起交給
全文搜索服務(wù)ElasticSearch 可以用ElasticSearch進(jìn)行自定義搜索 通過(guò)Kibana 來(lái)結(jié)合 自定義搜索進(jìn)行頁(yè)面展示,下圖是 Kibana官網(wǎng)上的流程圖
好了 讓我們一步步的把這套環(huán)境搭建起來(lái)吧,先看看都需要安裝什么軟件包
ruby 運(yùn)行Kibana 必須,
rubygems 安裝ruby擴(kuò)展必須
bundler 功能類(lèi)似于yum
JDK 運(yùn)行java程序必須
redis 用來(lái)處理日志隊(duì)列
logstash 收集、過(guò)濾日志
ElasticSearch 全文搜索服務(wù)(logstash集成了一個(gè))
kibana 頁(yè)面展示
這里有三臺(tái)服務(wù)器
192.168.233.128 logstash index,ElasticSearch,kibana,JDK
192.168.233.129 logstash agent,JDK
192.168.233.130 redis
首先到 logstash index服務(wù)器上面,logstash分為 index和aget ,agent負(fù)責(zé)監(jiān)控、過(guò)濾日志,index負(fù)責(zé)收集日志并將日志交給ElasticSearch 做搜索
此外 logstash 的收集方式分為 standalone 和 centralized。
standalone 是所有功能都在一個(gè)服務(wù)器上面,自發(fā)自收,centralized 就是集中收集,一臺(tái)服務(wù)器接收所有shipper(個(gè)人理解就是logstash agent)的日志。
其實(shí) logstash本身不分 什么 shipper 和 collector ,只不過(guò)就是配置文件不同而已,我們這次按照集中的方式來(lái)測(cè)試
在 logstash index上安裝基礎(chǔ)的軟件環(huán)境
- [192.168.233.128 root@nodec:~]
- # cd /soft/
- [192.168.233.128 root@nodec:/soft]
- # wget http://down1.chinaunix.net/distfiles/jdk-6u13-dlj-linux-i586.bin
- 從oracle下載實(shí)在是太慢了,從CU下載會(huì)快一些,如果需要最新版本請(qǐng)?jiān)L問(wèn)這里
- http://www.oracle.com/technetwork/java/javase/downloads/jdk7-downloads-1880260.html
- [192.168.233.128 root@nodec:/soft]
- # sh jdk-6u13-dlj-linux-i586.bin
- 輸入yes 便開(kāi)始安裝了
- 安裝完成后設(shè)置一下 JAVA_HOME
- [192.168.233.128 root@nodec:/soft/Kibana-0.2.0]
- # vim /etc/profile
- export JAVA_HOME=/usr/java
- export PATH=$JAVA_HOME/bin:$PATH
- export CLASSPATH=.:$JAVA_HOME/lib/tools.jar:$JAVA_HOME/lib/dt.jar:$CLASSPATH
-
- 安裝ruby 就比較簡(jiǎn)單了(Kibana需要ruby 1.8.7以上版本)
- [192.168.233.128 root@nodec:/soft]
- # yum install ruby rubygems
- ..... 安裝內(nèi)容省略
- 安裝完成后用 rubygems 來(lái)安裝bundler
- [192.168.233.128 root@nodec:/soft]
- # /usr/bin/gem install bundler
- .....
-
- ok 這樣基本的環(huán)境就已經(jīng)有了,下面就是安裝kibana 和 logstash
- 其實(shí)logstash 就是一個(gè)java腳本,不需要安裝... 下載即用
- [192.168.233.128 root@nodec:/soft]
- # wget http://logstash.objects.dreamhost.com/release/logstash-1.1.0-monolithic.jar
- 現(xiàn)在看看 這個(gè)腳本應(yīng)該怎么去執(zhí)行
- [192.168.233.128 root@nodec:/soft]
- # java -jar /soft/logstash-1.1.0-monolithic.jar -h
- No such command "-h"
- Available commands:
- -v
- -V
- --version
- agent
- web
- test
- 顯然沒(méi)有 -h 參數(shù),不過(guò)列出了能用的參數(shù),但是logstash的參數(shù)可不止這些,
- java -jar /soft/logstash-1.1.0-monolithic.jar agent --help
- 這些是在agent模式下的命令參數(shù)
- -f, --config CONFIGFILE
- Load the logstash config from a specific file, directory, or a wildcard. If given a directory or wildcard, config files will be read in order lexigraphically.
- -e CONFIGSTRING
- Use the given string as the configuration data. Same syntax as the config file. If not input is specified, 'stdin { type => stdin }' is default. If no output is specified, 'stdout { debug => true }}' is default.
- -w, --filterworks COUNT
- Run COUNT filter workers (default: 1)
- --watchdog-timeout TIMEOUT
- Set watchdog timeout value.
- -l, --log FILE
- Log to a given path. Default is to log to stdout
- -v
- Increase verbosity. There are multiple levels of verbosity available with '-vv' currently being the highest
- --pluginpath PLUGIN_PATH
- A colon-delimted path to find other logstash plugins in
- java -jar /soft/logstash-1.1.0-monolithic.jar web --help
- 下面的是在web界面的參數(shù)
- --log FILE
- Log to a given path. Default is stdout.
- --address ADDRESS
- Address on which to start webserver. Default is 0.0.0.0.
- --port PORT
- Port on which to start webserver. Default is 9292.
- -B, --elasticsearch-bind-host ADDRESS
- Address on which to bind elastic search node.
- -b, --backend URL
- The backend URL to use. Default is elasticsearch:/// (assumes multicast discovery). You can specify elasticsearch://[host][:port]/[clustername]
如果上面的這些命令都能執(zhí)行正常的話就表示 logstash可以使用了,但要讓他啟動(dòng)還需要一個(gè)配置文件
- [192.168.233.128 root@nodec:/soft]
-
- # vim redis.conf
-
- input {
- redis {
- host => '192.168.233.130'
- data_type => 'list'
- port => "6379"
- key => 'logstash:redis'
- type => 'redis-input'
- }
- }
-
- output {
- elasticsearch {
- embedded => true
- }
- }
解釋一下 logstash的配置文件由 input filter output 等幾個(gè)基本的部分組成,顧名思義 input 就是在那收集數(shù)據(jù),output就是輸出到哪,filter代表一個(gè)過(guò)濾規(guī)則意思是什么內(nèi)容 會(huì)被收集。 上面這段是讓 logstash 去192.168.233.130 這個(gè)redis服務(wù)器上去收集日志 redis端口為6379,key是 logstash:redis 類(lèi)型為 redis-input ,(注意:這幾個(gè)值必須跟logstash agent的 output 所對(duì)應(yīng)),收集完成后輸出到 elasticsearch ,embedded => true 的意思是使用logstash 內(nèi)嵌的 elasticsearch。如果有獨(dú)立的elasticsearch服務(wù)器,需要將 這條改為 host => 'elasticsearch的ip' port => 端口 好了,這個(gè)簡(jiǎn)單的配置文件可以讓logstash開(kāi)始啟動(dòng)了
- [192.168.233.128 root@nodec:/soft]
- # java -jar /soft/logstash-1.1.0-monolithic.jar agent -f /soft/redis.conf -- web --backend elasticsearch:///?local &
- [1] 5205
- ...這里要等待約5秒鐘... 為什么?去問(wèn)開(kāi)發(fā)者吧
- [192.168.233.128 root@nodec:/soft]
- # I, [2013-03-19T03:23:10.749000 #5205] INFO -- : Using beta plugin 'redis'. For more information about plugin statuses, see http://logstash.net/docs/1.1.0/plugin-status {"timestamp":"2013-03-19T03:23:10.732000 -0700","message":"Using beta plugin 'redis'. For more information about plugin statuses, see http://logstash.net/docs/1.1.0/plugin-status ","level":"info"}
- file:/soft/logstash-1.1.0-monolithic.jar!/gems/rack-1.3.4/lib/rack/backports/uri/common_192.rb:53 warning: already initialized constant WFKV_
- Mizuno 0.5.0 (Jetty 8.0.y.z-SNAPSHOT) listening on 0.0.0.0:9292
- 解釋一下 上面的命令 agent 代理模式 -f 指定配置文件 --web 其實(shí)是個(gè)分隔符等于又啟動(dòng)了一個(gè)命令,后面的參數(shù)就是開(kāi)啟一個(gè)web頁(yè)面默認(rèn)端口是9292,這個(gè)命令如果拆成兩個(gè)就是這個(gè)樣子
- java -jar /soft/logstash-1.1.0-monolithic.jar agent -f /soft/redis.conf &
- java -jar /soft/logstash-1.1.0-monolithic.jar web --backend elasticsearch:///?local & (其實(shí)如果用kibana來(lái)做web界面的話這一步完全可以省掉了)
好了,看到9292 端口啟動(dòng)就代表 啟動(dòng)成功了,檢查一下
- [192.168.233.128 root@nodec:/soft]
- # lsof -i:9292
- COMMAND PID USER FD TYPE DEVICE SIZE NODE NAME
- java 5205 root 465u IPv4 130805 TCP *:armtechdaemon (LISTEN)
- 其實(shí)logstash還啟動(dòng)了一個(gè)端口9200,因?yàn)閱?dòng)了內(nèi)嵌的 elasticsearch,這個(gè)9200是 elasticsearch在監(jiān)聽(tīng)
- [192.168.233.128 root@nodec:/soft]
- # lsof -i:9200
- COMMAND PID USER FD TYPE DEVICE SIZE NODE NAME
- java 5205 root 160u IPv4 130682 TCP *:wap-wsp (LISTEN)
現(xiàn)在可以通過(guò)瀏覽器訪問(wèn)一下 http://192.168.233.128:9292 看看logstash是的頁(yè)面是個(gè)什么樣子
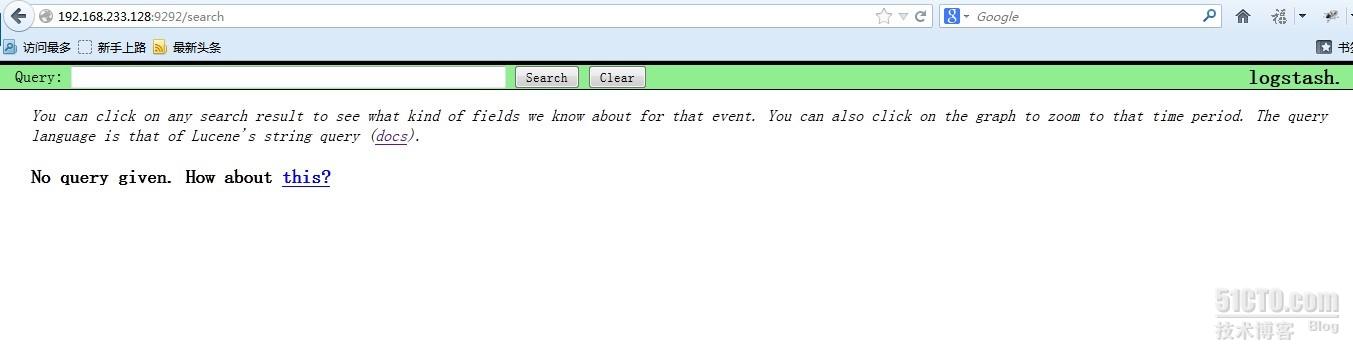 現(xiàn)在還不能搜索因?yàn)楝F(xiàn)在還沒(méi)有數(shù)據(jù),其實(shí)這個(gè)時(shí)候 http://192.168.233.128:9200 也是可以訪問(wèn)的,
很多開(kāi)發(fā)自己寫(xiě)代碼來(lái)調(diào)用elasticsearch 來(lái)實(shí)現(xiàn)他們自己的需要,這里就不多說(shuō)了
192.168.233.128 這臺(tái)logstash index的操作暫時(shí)告一段落,下面開(kāi)始配置logstash的agent
登錄到 服務(wù)器 192.168.233.129 安裝基本軟件包和logstash
- [192.168.233.129 root@noded:~]
- # cd /soft/
- [192.168.233.129 root@noded:/soft]
- # wget http://down1.chinaunix.net/distfiles/jdk-6u13-dlj-linux-i586.bin
- [192.168.233.129 root@noded:/soft]
- # sh jdk-6u13-dlj-linux-i586.bin
- 設(shè)置 JAVA_HOME
- [192.168.233.129 root@noded:/soft]
- # vim /etc/profile
- export JAVA_HOME=/usr/java
- export PATH=$JAVA_HOME/bin:$PATH
- export CLASSPATH=.:$JAVA_HOME/lib/tools.jar:$JAVA_HOME/lib/dt.jar:$CLASSPATH
- [192.168.233.129 root@noded:/soft]
- # yum install ruby
- 192.168.233.129 root@noded:/soft]
- # wget http://logstash.objects.dreamhost.com/release/logstash-1.1.0-monolithic.jar
- [192.168.233.129 root@noded:/soft]
- # vim redis.conf
- input {
- file {
- type => "producer"
- path => "/soft/apache.log"
- }
- file {
- type => "php-log"
- path => "/soft/php.log"
- }
- }
- filter {
- grep {
- match => [ "@message", "mysql|GET|error" ]
- }
- }
-
- output {
- redis {
- host => '192.168.233.130'
- data_type => 'list'
- key => 'logstash:redis'
- }
- }
大概說(shuō)一下這個(gè)配置文件 input 里的file就是要監(jiān)視的文件了 這里我監(jiān)視了兩個(gè)文件,如果這兩個(gè)文件有追加的內(nèi)容就會(huì)通過(guò)下面的output設(shè)置發(fā)給 redis服務(wù)器
filter 里的grep 意思就是 grep... 后面這段就是 日志內(nèi)容里面只要有匹配 mysql或GET或error的內(nèi)容就會(huì)被過(guò)濾出來(lái),發(fā)送到 logstash index
以上就是一個(gè)比較簡(jiǎn)單的配置文件了,讓我們啟動(dòng)他
- [192.168.233.129 root@noded:/soft]
- # java -jar /soft/logstash-1.1.0-monolithic.jar agent -f /soft/redis.conf &
- I, [2013-03-19T19:45:35.762000 #2721] INFO -- : Using beta plugin 'file'. For more information about plugin statuses, see http://logstash.net/docs/1.1.0/plugin-status {"timestamp":"2013-03-19T19:45:35.752000 -0700","message":"Using beta plugin 'file'. For more information about plugin statuses, see http://logstash.net/docs/1.1.0/plugin-status ","level":"info"}
- I, [2013-03-19T19:45:35.778000 #2721] INFO -- : Using beta plugin 'file'. For more information about plugin statuses, see http://logstash.net/docs/1.1.0/plugin-status {"timestamp":"2013-03-19T19:45:35.778000 -0700","message":"Using beta plugin 'file'. For more information about plugin statuses, see http://logstash.net/docs/1.1.0/plugin-status ","level":"info"}
- I, [2013-03-19T19:45:35.804000 #2721] INFO -- : Using beta plugin 'grep'. For more information about plugin statuses, see http://logstash.net/docs/1.1.0/plugin-status {"timestamp":"2013-03-19T19:45:35.803000 -0700","message":"Using beta plugin 'grep'. For more information about plugin statuses, see http://logstash.net/docs/1.1.0/plugin-status ","level":"info"}
- I, [2013-03-19T19:45:35.854000 #2721] INFO -- : Using beta plugin 'redis'. For more information about plugin statuses, see http://logstash.net/docs/1.1.0/plugin-status {"timestamp":"2013-03-19T19:45:35.853000 -0700","message":"Using beta plugin 'redis'. For more information about plugin statuses, see http://logstash.net/docs/1.1.0/plugin-status ","level":"info"}
只要沒(méi)有 warning 和 error就算是正常啟動(dòng)了
啟動(dòng)之前請(qǐng)確定 192.168.233.130的 redis服務(wù)器已經(jīng)啟動(dòng),不然會(huì)報(bào)錯(cuò)
下面登錄到 192.168.233.130 上看看 redis服務(wù)的狀態(tài)
- [192.168.233.130 root@nodea:/data/redis/etc]
- # lsof -i:6379
- COMMAND PID USER FD TYPE DEVICE SIZE NODE NAME
- redis-ser 2732 root 4u IPv4 7946 TCP *:6379 (LISTEN)
- redis-ser 2732 root 5u IPv4 7963 TCP localhost.localdomain:6379->localhost.localdomain:19214 (ESTABLISHED)
- java 2733 root 9u IPv4 7959 TCP localhost.localdomain:19214->localhost.localdomain:6379 (ESTABLISHED)
- 狀態(tài)正常,端口處于監(jiān)聽(tīng)狀態(tài),我用的是最簡(jiǎn)單的 配置,
- [192.168.233.130 root@nodea:/data/redis/etc]
- # vim redis.conf
- #this is the config file for redis
- pidfile /var/run/redis.pid
- port 6379
- timeout 0
- loglevel verbose
- logfile /data/redis/log/redis.log
- dbfilename dump.rdb
- dir /data/redis/db/
- vm-swap-file /tmp/redis.swap
- activerehashing yes
- 啟動(dòng)命令如下
- [192.168.233.130 root@nodea:/data/redis/etc]
- # redis-server /data/redis/etc/redis.conf &
下載安裝就比較簡(jiǎn)單了
- [192.168.233.130 root@nodea:/soft]
- # wget http://redis.googlecode.com/files/redis-2.4.14.tar.gz
- [192.168.233.130 root@nodea:/data/redis/etc]
- # make –j24
- [192.168.233.130 root@nodea:/data/redis/etc]
- # make install
配置文件里的那幾個(gè)路徑要提前建好
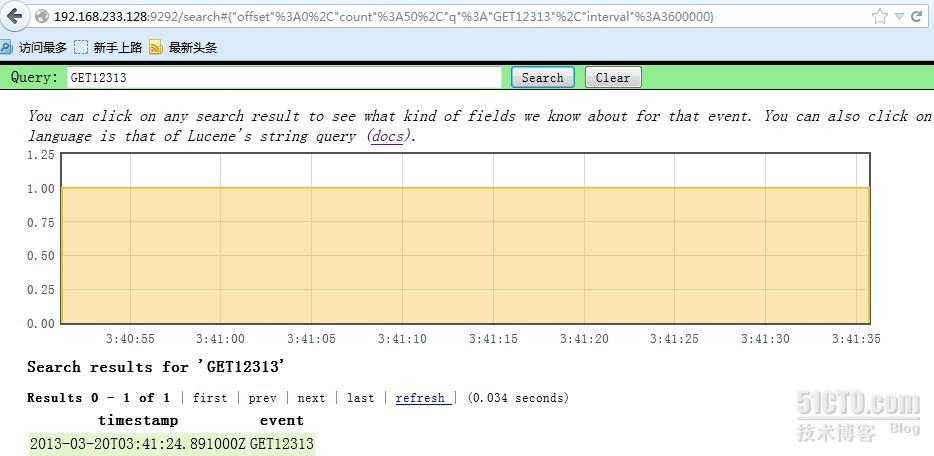
最后我們回到 logstash agent 上面測(cè)試一下
- [192.168.233.129 root@noded:/soft]
- # echo GET12313 >> apache.log
- [192.168.233.129 root@noded:/soft]
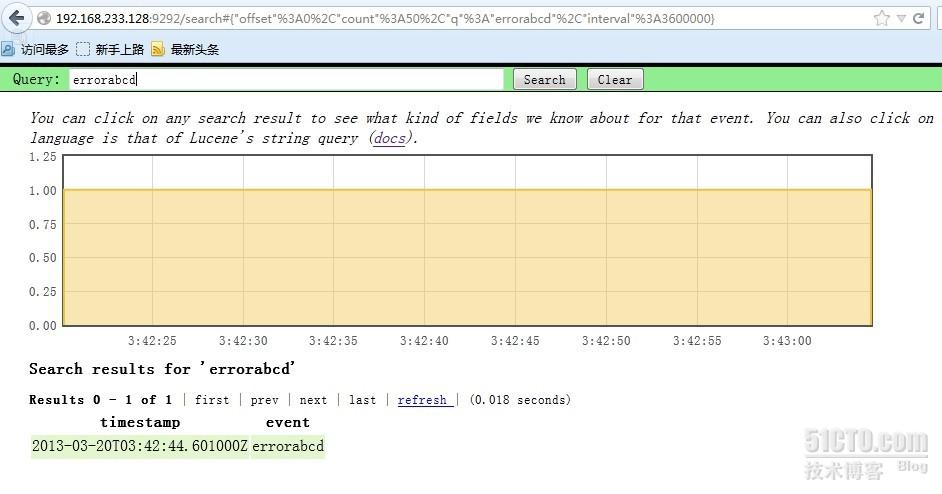
- # echo errorabcd >> apache.log
ok 到 http://192.168.233.128:9292 去搜索一下 剛才的兩個(gè)內(nèi)容
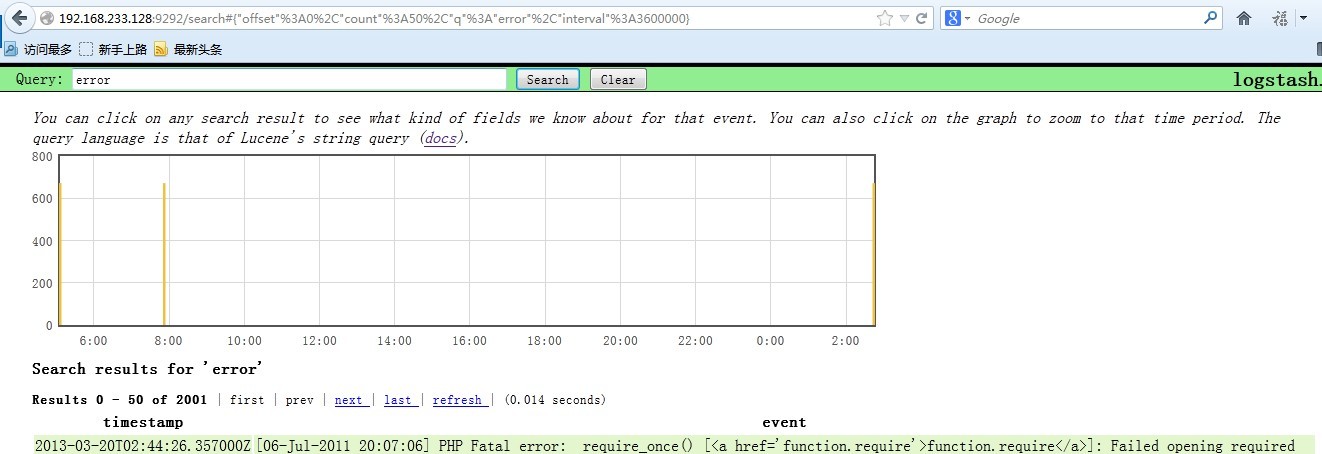
嗯,就是這樣了,我現(xiàn)在找個(gè)php的錯(cuò)誤日志給他追加到php.log文件里
[192.168.233.129 root@noded:/soft]
# cat php-error.log >> php.log
在看看 logstash的頁(yè)面 搜索一下 error
OK,最后就是 Kibana了 ,我把Kibana裝在了 logstash index上面
下載地址為 http://kibana.org/intro.html
- [192.168.233.128 root@nodec:/soft]
- # tar xf Kibana-0.2.0.tar.gz
- [192.168.233.128 root@nodec:/soft]
- # cd Kibana-0.2.0
- [192.168.233.128 root@nodec:/soft/Kibana-0.2.0]
- # bundle install
- 直接安裝就好了,非常簡(jiǎn)單,因?yàn)橹霸蹅円呀?jīng)安裝好了 bundle
- 編輯配置文件,指定 elasticsearch 的位置
- [192.168.233.128 root@nodec:/soft/Kibana-0.2.0]
- # vim KibanaConfig.rb
- .....
- Elasticsearch = "localhost:9200"
- KibanaPort = 5601
- KibanaHost = '0.0.0.0'
- .....
- 主要是這幾個(gè)參數(shù)
- 啟動(dòng)的話需要ruby
- [192.168.233.128 root@nodec:/soft/Kibana-0.2.0]
- # /usr/bin/ruby kibana.rb &
- [192.168.233.128 root@nodec:/soft/Kibana-0.2.0]
- # == Sinatra/1.3.5 has taken the stage on 5601 for development with backup from Thin
- >> Thin web server (v1.5.0 codename Knife)
- >> Maximum connections set to 1024
- >> Listening on 0.0.0.0:5601, CTRL+C to stop
- 如果ruby的東西都不缺的話,啟動(dòng)會(huì)很順利,ok 現(xiàn)在看看5601端口的狀態(tài)
- [192.168.233.128 root@nodec:/soft/Kibana-0.2.0]
- # lsof -i:5601
- COMMAND PID USER FD TYPE DEVICE SIZE NODE NAME
- ruby 3116 root 5u IPv4 28947 TCP *:esmagent (LISTEN)
訪問(wèn)一下 試試看 http://192.168.233.128:5601 嘗試搜索一下php的錯(cuò)誤日志,比如mysql

呵呵,要的就是這個(gè)效果,日志會(huì)實(shí)時(shí)的匯總到 logstash index 上供我們查詢,當(dāng)然這只是開(kāi)始使用logstash的第一步而已,更多的高級(jí)功能可以看看官方文檔
http://logstash.net/docs/1.1.9/
如果有問(wèn)題大家可以一起探討,我也是剛開(kāi)始接觸這個(gè)東東,收集日志是相當(dāng)方便啊,據(jù)說(shuō)還能跟nagios結(jié)合. 呵呵