JFreeChart 1.0.2的動態(tài)應(yīng)用,根據(jù)數(shù)據(jù)庫中的數(shù)據(jù)生成餅圖:(部分來自網(wǎng)頁)
本文用的是JFreeChart 1.0.2 (根據(jù)版本不同需要根據(jù)類修改部分代碼)
下載:http://www.jfree.org/jfreechart/index.html
下載后解壓jfreechart-1.0.2.zip,會發(fā)現(xiàn)在lib下有幾個jar文件,本文只介紹生成餅圖的例子:
1,首先將lib下的jcommon-1.0.5.jar和jfreechart-1.0.2.jar放到你的項目的lib下面,
2,一個用于實驗的表:(client)
|
id
|
client_name
|
|
1
|
一級分銷商
|
|
2
|
二級分銷商
|
|
3
|
三級分銷商
|
3,建立一個用于查詢數(shù)據(jù)的類:
package com.drp.statreport;
import java.sql.*;
import java.util.HashMap;
import java.util.Map;
import com.drp.util.DB;//我的一個用于鏈接數(shù)據(jù)庫的javabeen
/**
* 統(tǒng)計報表管理類,采用單例模式
* @author qiao
*/
public class StateReportManger {
private static StateReportManger intense = new StateReportManger();
private StateReportManger(){}
public static StateReportManger getIntense(){
return intense;
}
/**
* 返回分銷商級別數(shù)
* @return 返回Map<client_name,數(shù)量> eg:("一級分銷商,10","二級分銷商,10")
*/
public Map getClientLevelCount(){
Map map = new HashMap();
String sql = "select client_name,count(id) as qty from client group by client_name ";
Connection conn = null;
Statement stmt = null;
ResultSet rs = null;
try{
conn = DB.getConn();//自己的javabeen鏈接數(shù)據(jù)庫
stmt = conn.createStatement();
rs = stmt.executeQuery(sql);
while(rs.next()){
map.put(rs.getString("client_name"), rs.getInt("qty"));
}
}catch(SQLException e){
e.printStackTrace();
}finally{
DB.close(rs);//javabeen用于關(guān)閉資源
DB.close(stmt);
DB.close(conn);
}
return map;
}
}
4,建立一個servlet輸出圖形:
Web.xml中添加如下配置:
<servlet>
<servlet-name>ChartDemoServlet</servlet-name>
<servlet-class> com.drp.util.servlet.ChartDemoServlet</servlet-class>
</servlet>
<servlet-mapping>
<servlet-name>ChartDemoServlet</servlet-name>
<url-pattern>/servlet/ChartDemoServlet</url-pattern>
</servlet-mapping>
package com.drp.util.servlet;
import java.io.FileOutputStream;
import java.io.IOException;
import java.text.DecimalFormat;
import java.text.NumberFormat;
import java.util.*;
import javax.servlet.*;
import javax.servlet.http.HttpServlet;
import org.jfree.data.*;
import org.jfree.data.general.DefaultPieDataset;
import org.jfree.chart.*;
import org.jfree.chart.labels.StandardPieSectionLabelGenerator;
import org.jfree.chart.plot.PiePlot3D;
import com.drp.statreport.StateReportManger;
/**
* 演示通過servlet直接輸出圖表
* @author
*/
public class ChartDemoServlet extends HttpServlet {
public void service(ServletRequest req, ServletResponse res)
throws ServletException, IOException
{
res.setContentType("image/jpeg");
DefaultPieDataset data = getDataSet();
JFreeChart chart = ChartFactory.createPieChart3D("分銷商分布",data,true,false,false);
PiePlot3D plot=(PiePlot3D)chart.getPlot();
// 圖片中顯示百分比:默認(rèn)方式
//plot.setLabelGenerator(new StandardPieSectionLabelGenerator(StandardPieToolTipGenerator.DEFAULT_TOOLTIP_FORMAT));
// 圖片中顯示百分比:自定義方式,{0} 表示選項, {1} 表示數(shù)值, {2} 表示所占比例 ,小數(shù)點后兩位
plot.setLabelGenerator(new StandardPieSectionLabelGenerator("{0}={1}({2})", NumberFormat.getNumberInstance(), new DecimalFormat("0.00%")));
// 圖例顯示百分比:自定義方式, {0} 表示選項, {1} 表示數(shù)值, {2} 表示所占比例
plot.setLegendLabelGenerator(new StandardPieSectionLabelGenerator("{0}={1}({2})"));
ChartUtilities.writeChartAsJPEG(res.getOutputStream(),
1.0f,chart,400,300,null);
}
/**
* 獲取一個演示用的簡單數(shù)據(jù)集對象
* @return
*/
private static DefaultPieDataset getDataSet() {
DefaultPieDataset dataset = new DefaultPieDataset();
Map map = StateReportManger.getIntense().getClientLevelCount(); //調(diào)用getClientLevelCount()得到所有的數(shù)據(jù)
for(Iterator iter = map.entrySet().iterator();iter.hasNext();){//遍歷,用到Map的. entrySet()方法
Map.Entry entry = (Map.Entry) iter.next();
dataset.setValue((String)entry.getKey(), Double.parseDouble(String.valueOf(entry.getValue())));//設(shè)置數(shù)據(jù)
}
return dataset;
}
}
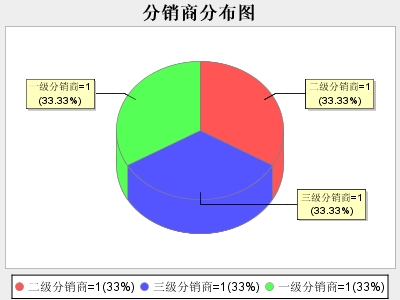
5,在地址欄輸入http://localhost:8080/(你的項目名稱)/servlet/ChartDemoServlet 就可以看到如下圖: