常使用web服務器的朋友大都了解,一般的web server有兩部分日志:
一是運行中的日志,它主要記錄運行的一些信息,尤其是一些異常錯誤日志信息
二是訪問日志信息,它記錄的訪問的時間,IP,訪問的資料等相關信息。
現在我來和大家介紹一下利用tomcat產生的訪問日志數據,我們能做哪些有效的分析數據?
首先是配置tomcat訪問日志數據,默認情況下訪問日志沒有打開,配置的方式如下:
編輯 ${catalina}/conf/server.xml文件.注:${catalina}是tomcat的安裝目錄
把以下的注釋(<!-- -->)去掉即可。
<!--
<Valve className="org.apache.catalina.valves.AccessLogValve"
directory="logs" prefix="localhost_access_log." suffix=".txt"
pattern="common" resolveHosts="false"/>
-->
其中 directory是產生的目錄 tomcat安裝${catalina}作為當前目錄
pattern表示日志生產的格式,common是tomcat提供的一個標準設置格式。其具體的表達式為 %h %l %u %t "%r" %s %b
但本人建議采用以下具體的配置,因為標準配置有一些重要的日志數據無法生。
%h %l %u %t "%r" %s %b %T
具體的日志產生樣式說明如下(從官方文檔中摘錄):
* %a - Remote IP address
* %A - Local IP address
* %b - Bytes sent, excluding HTTP headers, or '-' if zero
* %B - Bytes sent, excluding HTTP headers
* %h - Remote host name (or IP address if resolveHosts is false)
* %H - Request protocol
* %l - Remote logical username from identd (always returns '-')
* %m - Request method (GET, POST, etc.)
* %p - Local port on which this request was received
* %q - Query string (prepended with a '?' if it exists)
* %r - First line of the request (method and request URI)
* %s - HTTP status code of the response
* %S - User session ID
* %t - Date and time, in Common Log Format
* %u - Remote user that was authenticated (if any), else '-'
* %U - Requested URL path
* %v - Local server name
* %D - Time taken to process the request, in millis
* %T - Time taken to process the request, in seconds
There is also support to write information from the cookie, incoming header, the Session or something else in the ServletRequest. It is modeled after the apache syntax:
* %{xxx}i for incoming headers
* %{xxx}c for a specific cookie
* %{xxx}r xxx is an attribute in the ServletRequest
* %{xxx}s xxx is an attribute in the HttpSession
現在我們回頭再來看一下下面這個配置 %h %l %u %t "%r" %s %b %T 生產的訪問日志數據,我們可以做哪些事?
先看一下,我們能得到的數據有:
* %h 訪問的用戶IP地址
* %l 訪問邏輯用戶名,通常返回'-'
* %u 訪問驗證用戶名,通常返回'-'
* %t 訪問日時
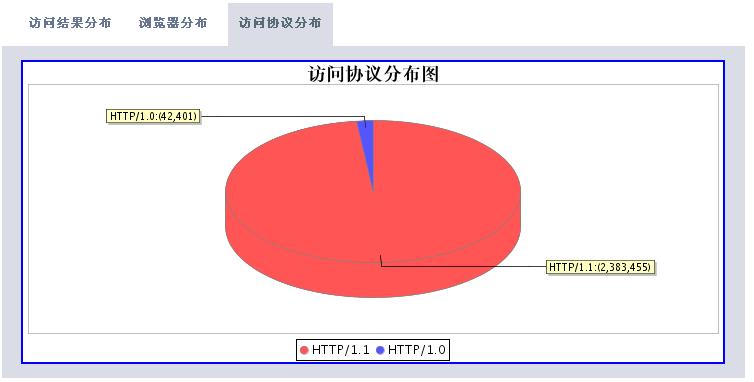
* %r 訪問的方式(post或者是get),訪問的資源和使用的http協議版本
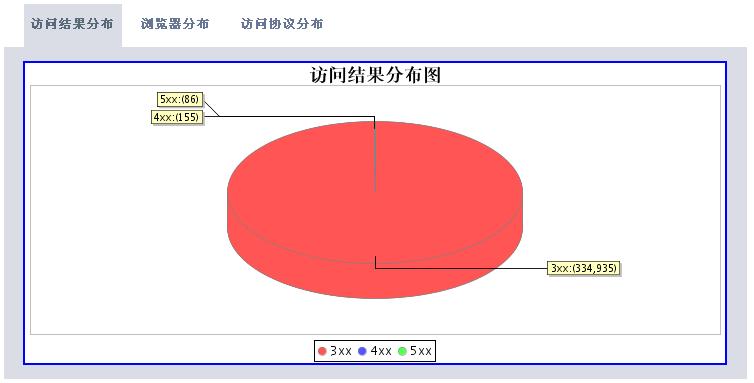
* %s 訪問返回的http狀態
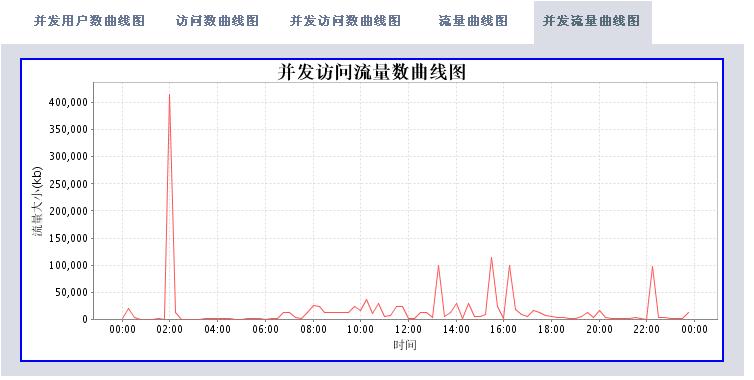
* %b 訪問資源返回的流量
* %T 訪問所使用的時間
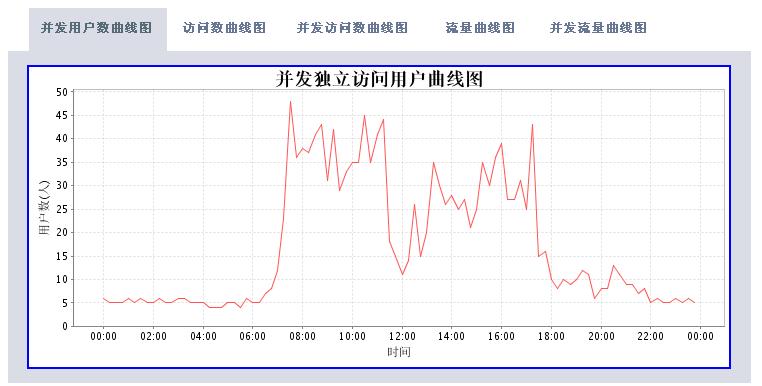
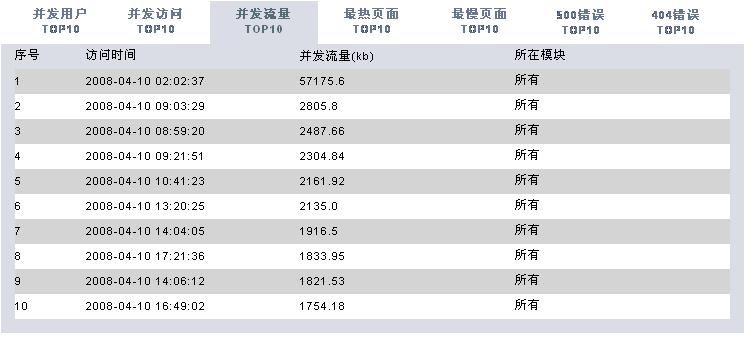
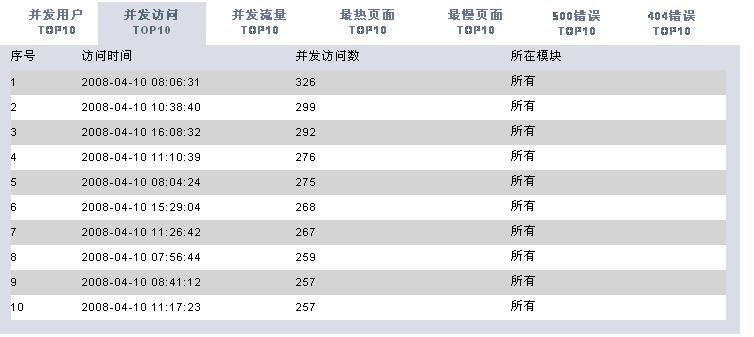
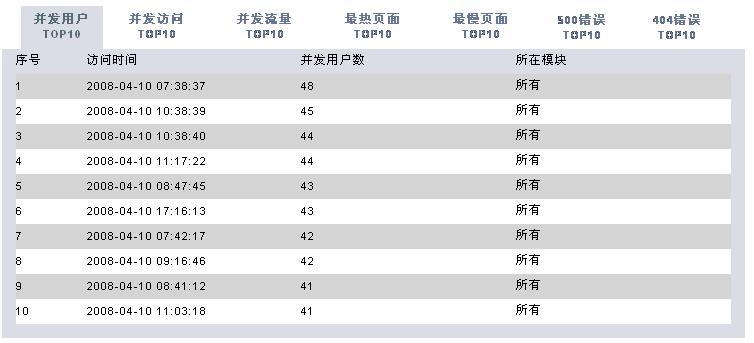
有了這些數據,我們可以根據時間段做以下的分析處理(圖片使用jfreechart工具動態生成):
* 獨立IP數統計
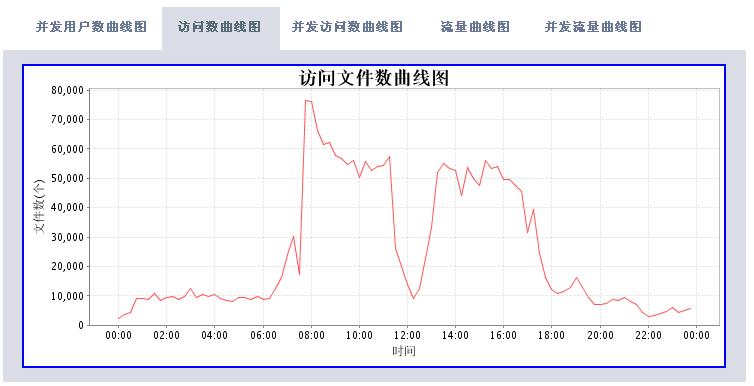
* 訪問請求數統計
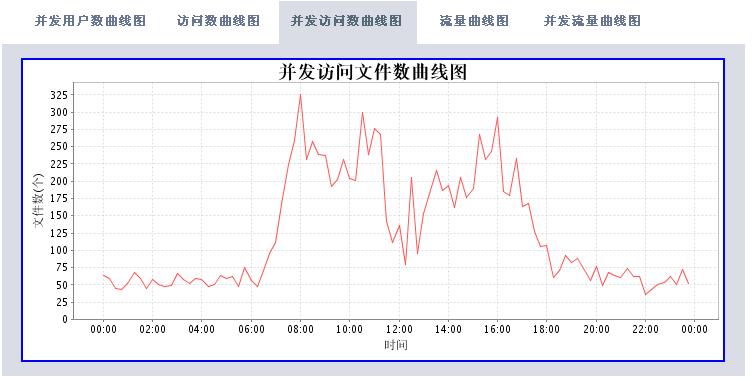
* 訪問資料文件數統計
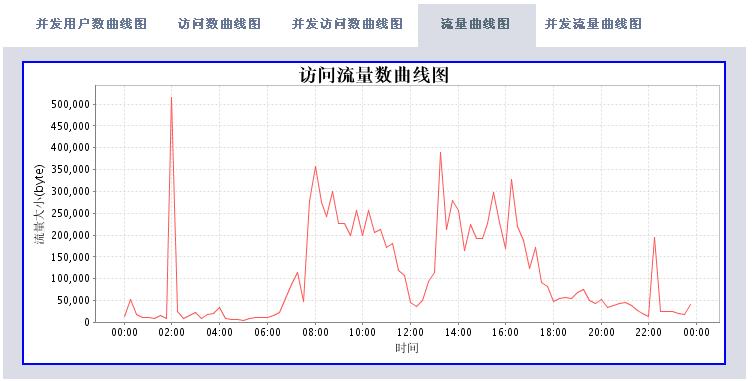
* 訪問流量統計
* 訪問處理響應時間統計
* 統計所有404錯誤頁面
* 統計所有500錯誤的頁面
* 統計訪問最頻繁頁面
* 統計訪問處理時間最久頁面
* 統計并發訪問頻率最高的頁面

分析工具包括兩大部分,一個是后臺解釋程序,每天執行一次對后臺日志數據進行解析后保存到數據庫中。
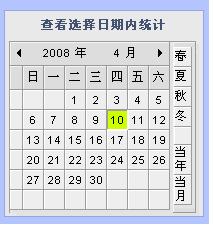
第二個是顯示程序,從數據庫中查詢數據并生成相應的圖表信息。
posted on 2008-04-14 08:11
x.matthew 閱讀(15794)
評論(80) 編輯 收藏 所屬分類:
Application Server