Lars Vogel
Version 0.8
Copyright © 2009 Lars Vogel
16.12.2009
Eclipse Debugging
This article describes how to debug a Java application in Eclipse.
This article is based on Eclipse 3.5 (Eclipse Galileo).
1. Overview
The installation and usage of Eclipse as Java IDE is described in Eclipse Java IDE
This article will focus on how to debug Java applications in Eclipse.
2. Example
The following assumes you know know to develop simple standard Java programs. If you don't know this please see Eclipse Java IDE .
Create a Java project "de.vogella.debug.first" with the package "de.vogella.debug.first" and the following classes.
//Counter.java
package de.vogella.debug.first;

public class Counter {
	private int result=0;
	public int getResult() {
		return result;
	}

	public void count() {
		for (int i = 0; i < 100; i++) {
			result += i +1;
		}
	}
}
//Main.java
package de.vogella.debug.first;

public class Main {

	/**
	 * @param args
	 */
	public static void main(String[] args) {
		Counter counter = new Counter();
		counter.count();
		System.out.println("We have counted " + counter.getResult());
	}

}
3. Debug
3.1. Setting Breakpoints
To set breakpoints right click in the small left column in your source code editor and select toggle breakpoint. Or you can double click on this place.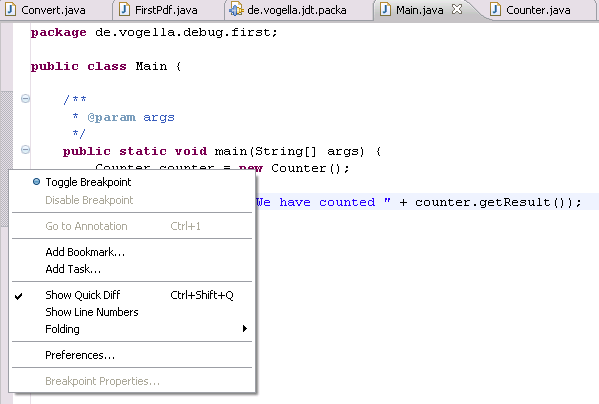
3.2. Starting the Debugger
You can debug your application with selecting your Java file which contains a main method, right click it and select Run -> Debug. 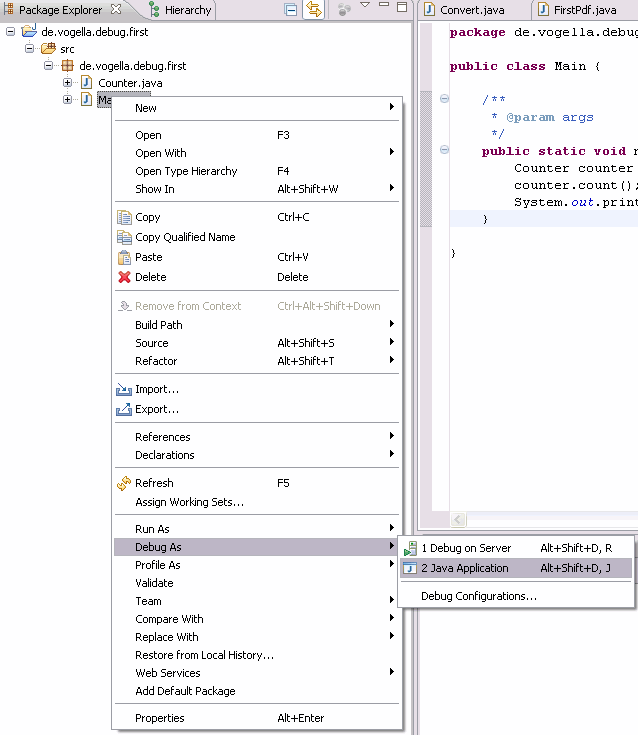
If you start the debugger the first time Eclipse will asked you if you want to switch to the debug perspective. Answer "yes", you should then see a perspective similar to the following.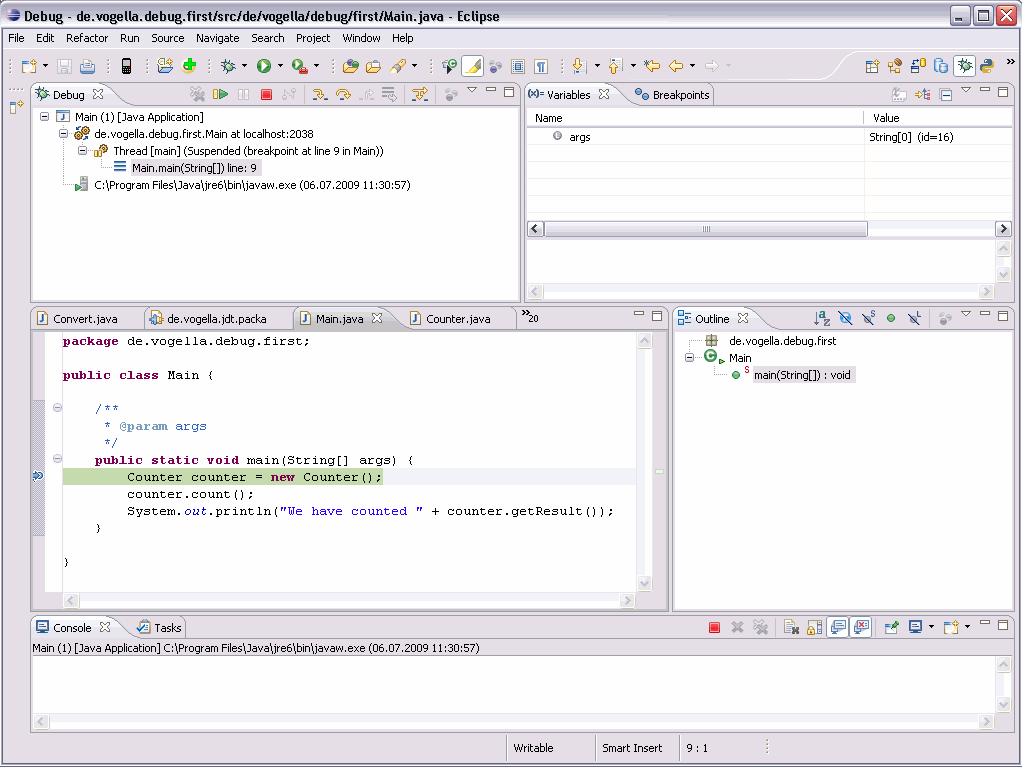
You can use F5 / F6, F7 and F8 to step through your coding.
Table 1. Debugging Key bindings
| Command | Description |
|---|---|
| F5 | Goes to the next step in your program. If the next step is a method / function this command will jump into the associated code. |
| F6 | F6 will step over the call, e.g. it will call a method / function without entering the associated code. |
| F7 | F7 will go to the caller of the method/ function. So this will leave the current code and go to the calling code. |
| F8 | Use F8 to go to the next breakpoint. If no further breakpoint is encountered then the program will normally run. |
You can of course use the ui to debug. The following displays the keybindings for the debug buttons. 
3.3. Stack
The current stack is displayed in the "Debug" view. 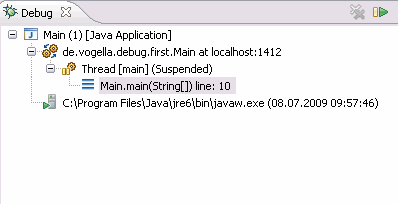
3.4. Variables
The view "Variables" displays fields and local variables from the current stack. 
Use the menu to display static variables.
Via the menu you can also customize the displayed columns, e.g. you can show the acutual and the declared type.
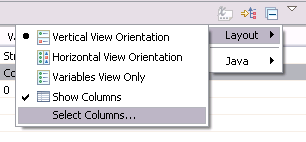
Another nice feature is the the "New Detail Formater" in which you can define how a variable is displayed. For example the toString method in our counter shows something meaningless, e.g. "de.vogella.debug.first.Counter@587c94". Use right mouse click on the variable -> "New Details Formater"
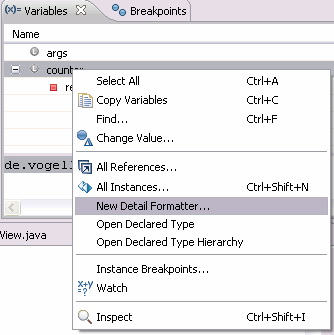
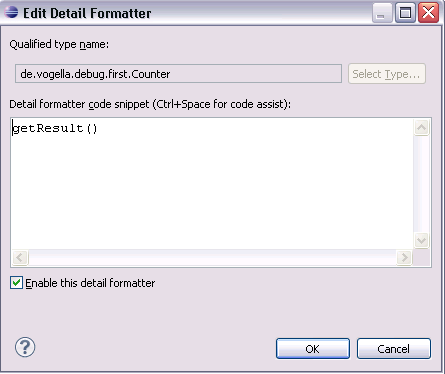
Maintain the following code to get the output "0" (or whatever is field result holds at this point).
4. Advanced Debugging
4.1. Skip all breakpoints
If you want to temporary de-activate all your breakpoints you can press the button "Skip all breakpoints" which is visible if you select the tab breakpoints.
If you press this button again the breakpoints will get activated again.![]()
4.2. Breakpoint Properties
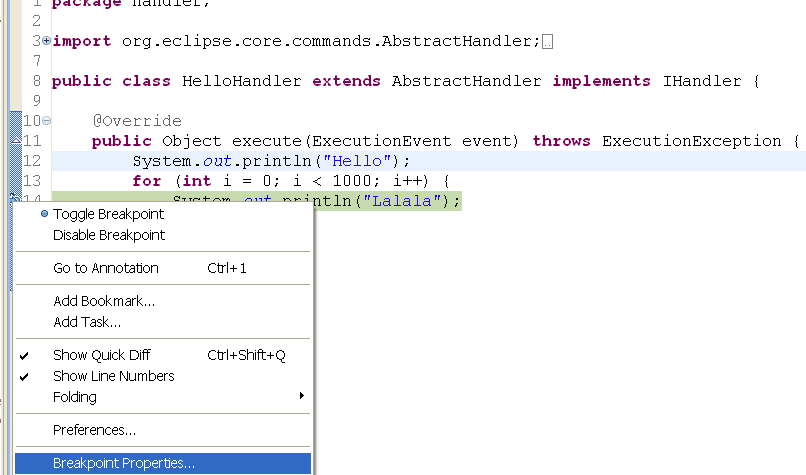
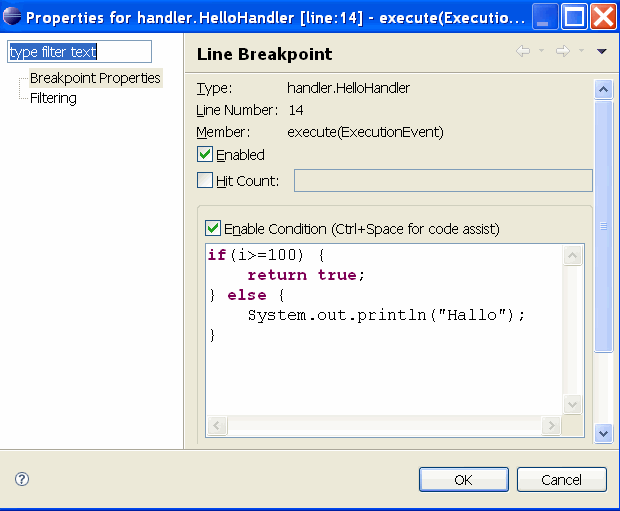
After setting a breakpoint you can select the properties of the breakpoint to for example use a condition to restrict when the breakpoint should get toggeled. In the properties you can for example restrict that the breakpoint should only be executed the 12 hit (Hit Count) or you can put in a conditional expression (which you can also use for logging if you want).
4.3. Watchpoint
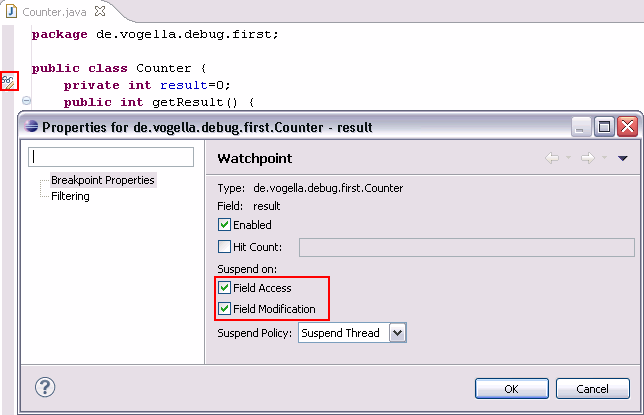
A watchpoint is a breakpoint at which is stop whenever a field read or changed. You can set a watchpoint through a double-click on the left side before the field declaration. Via the properties of the watchpoint you can define if the breakpoint should be hit during read access (Field Access) or during write access (Field Modification).
4.4. Exception Breakpoint
The application is stopped if the specified exception is thrown. To define an exception breakpoint click on the following icon. ![]()
You can define if you want to stop and caught and / or uncaught exceptions.
4.5. Method Breakpoint
A method breakpoint is defined via double-click in the left border of the editor and the method head. You can define if you want to stop the program during method entry of after leaving the method. 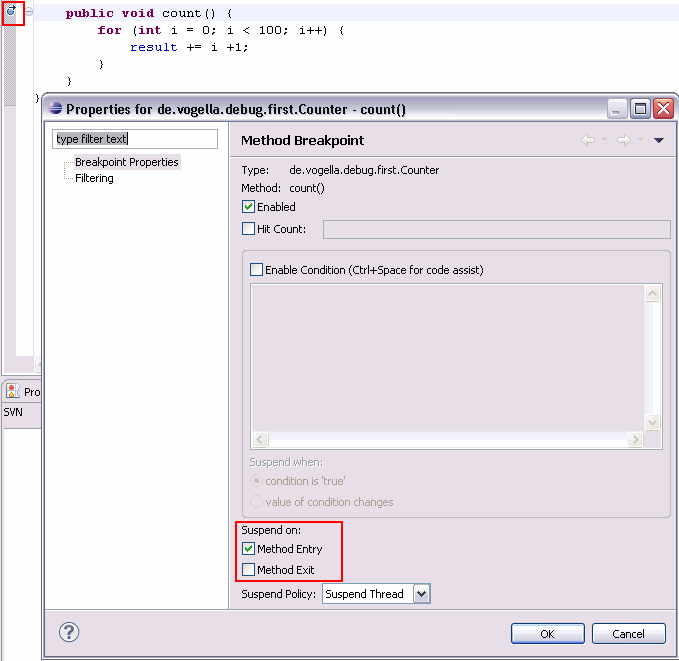
4.6. Class breakpoint
A Class Load Breakpoint will stop when the class is loaded. Right-click on a class in the Outline View and choose "Toggle Class Load Breakpoint" 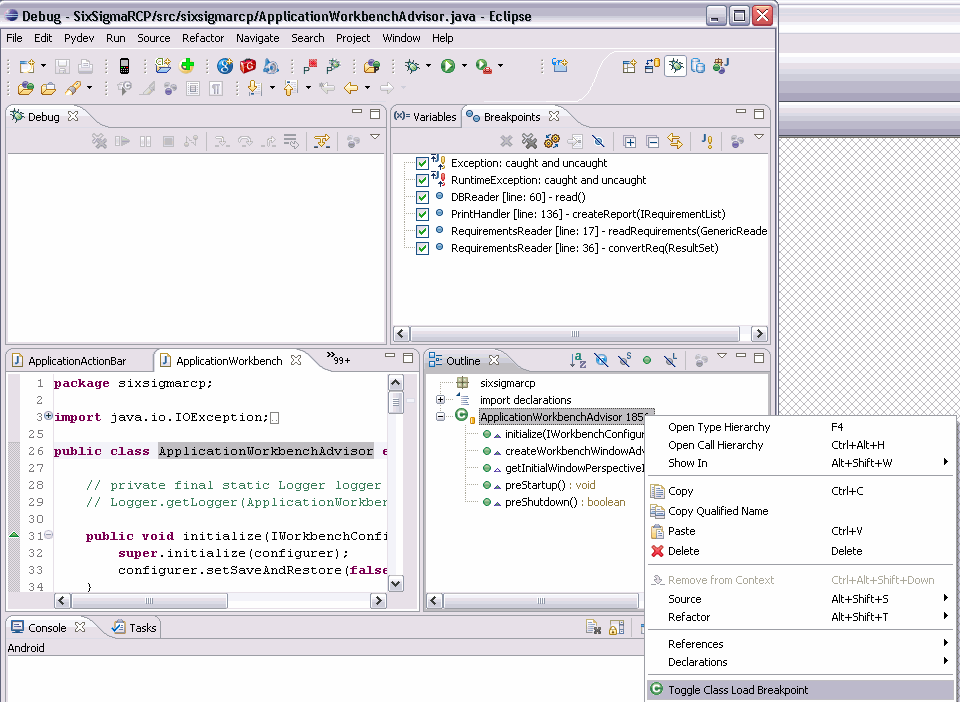
4.7. Hit Count
For every breakpoint you can define via the properties the hit count. If you use the hit count then the application is stop then the breakpoint is reached the number of times defined in the hit count.
4.8. Drop to frame
Eclipse allows you to select any level (frame) in the call stack during debugging and set the JVM to restart to that point.
This allows you to rerun a part of your program. Be aware that variables which have been modified by the code which you reset remain modified. The drop to frame will return to the the code. Changes made by the code, e.g. to variables / databases will not be reset.


