以前一直是用JFreeChart畫統(tǒng)計圖的,不過JFreeChart畫出來的圖形不夠精細(xì),看起來有些模糊,今天在網(wǎng)上看到另外一個工具ChartDirector,這是一個商業(yè)版本的工具,不過也可以免費使用,只是在畫出來的圖形下面都有一條它的廣告條。
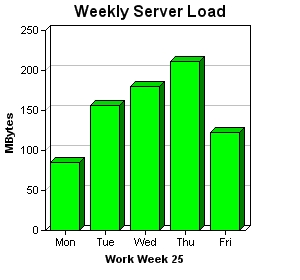
下面是它的一個柱狀圖的例子:
范例程序:
 <%@page import="ChartDirector.*" %>
<%
//The data for the bar chart

 double[] data =
  {85, 156, 179.5, 211, 123};
//The labels for the bar chart
String[] labels = {"Mon", "Tue", "Wed", "Thu", "Fri"};
//Create a XYChart object of size 300 x 280 pixels
XYChart c = new XYChart(300, 280);
//Set the plotarea at (45, 30) and of size 200 x 200 pixels
c.setPlotArea(45, 30, 200, 200);
//Add a title to the chart
c.addTitle("Weekly Server Load");
//Add a title to the y axis
c.yAxis().setTitle("MBytes");
//Add a title to the x axis
c.xAxis().setTitle("Work Week 25");
//Add a bar chart layer with green (0x00ff00) bars using the given data
c.addBarLayer(data, 0xff00).set3D();
//Set the labels on the x axis.
c.xAxis().setLabels(labels);
//output the chart
String chart1URL = c.makeSession(request, "chart1");
//include tool tip for the chart
String imageMap1 = c.getHTMLImageMap("", "", "title='{xLabel}: {value} MBytes'")
;
%>
<html>
<body topmargin="5" leftmargin="5" rightmargin="0">
<div style="font-size:18pt; font-family:verdana; font-weight:bold">
3D Bar Chart
</div>
<hr color="#000080">
<a href="viewsource.jsp?file=<%=request.getServletPath()%>">
<font size="2" face="Verdana">View Chart Source Code</font>
</a>
</div>
<br>
<img src='<%=response.encodeURL("getchart.jsp?"+chart1URL)%>'
usemap="#map1" border="0">
<map name="map1"><%=imageMap1%></map>
</body>
</html>
如果要在柱的頂部顯示數(shù)值,可以調(diào)用Layer的setDataLabelFormat方法設(shè)置,范例:layer.setDataLabelFormat("{value}");
其它的例子可以參考它的文檔的說明。ChartDirector的網(wǎng)址:http://www.advsofteng.com
posted on 2005-06-14 17:46
小米 閱讀(5248)
評論(5) 編輯 收藏 所屬分類:
Java