2009年12月7日

          c++ difference from java
          1. take charge of object management , negotiate ownershiop ,use scoped_ptr,
             not to transfer other's ownership
          2. use c++ template to express seperation corncern ,such as (static)polymorphy and policy
          3. disable copy constructor and assign operator by yourself
          4. polymorphy by pointer
          5. 使用 template ,macro 取得類似動態語言的能力
          6. 偏好無狀態的 函數
          posted @ 2010-02-03 11:43 西津渡 閱讀(263) | 評論 (0)編輯 收藏
           
              只有注冊用戶登錄后才能閱讀該文。閱讀全文
          posted @ 2010-01-15 12:22 西津渡 閱讀(102) | 評論 (0)編輯 收藏
           

          Myisam is preferred without transaction and little update(delete)

          Big than 4G datafile can user Myisam merge table.

          InnoDB with auto_increment primary key is preferred.

          Few storage process

          Guess: 20m records max per table , 500G data max per tablespace , 256 tables per database (may problem)

          Use prepared statement and  batch

          Optimize Your Queries For the Query Cache

          // query cache does NOT work
          $r = mysql_query("SELECT username FROM user WHERE signup_date >= CURDATE()");
           
          // query cache works!
          $today = date("Y-m-d");
          $r = mysql_query("SELECT username FROM user WHERE signup_date >= '$today'");

          EXPLAIN Your SELECT Queries

          LIMIT 1 When Getting a Unique Row

          Index and Use Same Column Types for Joins

          Do Not ORDER BY RAND()

          Avoid SELECT *

          t is a good habit to always specify which columns you need when you are doing your SELECT’s.

          Use ENUM over VARCHAR

          Use NOT NULL If You Can

          Store IP Addresses as UNSIGNED INT (?)

          Fixed-length (Static) Tables are Faster

          Vertical Partitioning

          Vertical Partitioning is the act of splitting your table structure in a vertical manner for optimization reasons.

          Example 1: You might have a users table that contains home addresses, that do not get read often. You can choose to split your table and store the address info on a separate table. This way your main users table will shrink in size. As you know, smaller tables perform faster.

          Example 2: You have a “last_login” field in your table. It updates every time a user logs in to the website. But every update on a table causes the query cache for that table to be flushed. You can put that field into another table to keep updates to your users table to a minimum.

          But you also need to make sure you don’t constantly need to join these 2 tables after the partitioning or you might actually suffer performance decline.

          Split the Big DELETE or INSERT Queries

          If you have some kind of maintenance script that needs to delete large numbers of rows, just use the LIMIT clause to do it in smaller batches to avoid this congestion.

          Smaller Columns Are Faster

          Use an Object Relational Mapper

          f you do not need the time component, use DATE instead of DATETIME.

          Consider horizontally spitting many-columned tables if they contain a lot of NULLs or rarely used columns.

          Be an SQL programmer who thinks in sets, not procedural programming paradigms

          InnoDB can’t optimize SELECT COUNT(*) queries. Use counter tables! That’s how to scale InnoDB.

          Prefer MM with hive

          refer :

          http://blog.tuvinh.com/top-20-mysql-best-practices/

          posted @ 2010-01-05 13:38 西津渡 閱讀(392) | 評論 (0)編輯 收藏
           
              只有注冊用戶登錄后才能閱讀該文。閱讀全文
          posted @ 2010-01-04 15:11 西津渡 閱讀(79) | 評論 (0)編輯 收藏
           

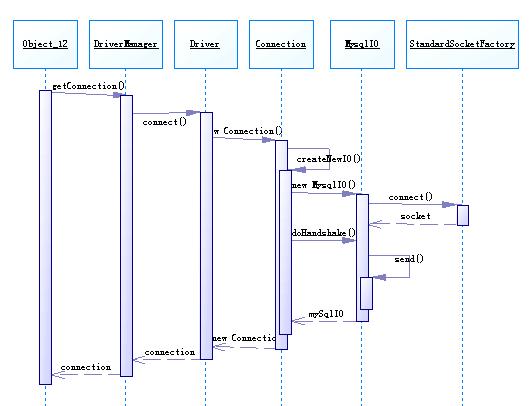
          從時序圖中可以看到,createNewIO()就是新建了一個com.mysql.jdbc.MysqlIO,利用 com.mysql.jdbc.StandardSocketFactory來創建一個socket。然后就由這個mySqlIO來與MySql服務器進行握手(doHandshake()),這個doHandshake主要用來初始化與Mysql server的連接,負責登陸服務器和處理連接錯誤。在其中會分析所連接的mysql server的版本,根據不同的版本以及是否使用SSL加密數據都有不同的處理方式,并把要傳輸給數據庫server的數據都放在一個叫做packet的 buffer中,調用send()方法往outputStream中寫入要發送的數據。


          useServerPreparedStmts置為true的話,mysql驅動可以通過PreparedStatement的子類ServerPreparedStatement來實現真正的PreparedStatement的功能


          第一位表示數據包的開始位置,就是數據存放的起始位置,一般都設置為0,就是從第一個位置開始。第二和第三個字節標識了這個數據包的大小,注意的是,這個大小是出去標識的4個字節的大小,對于非最后一個數據包來說,這個大小都是一樣的,就是splitSize,也就是maxThreeBytes,它的值是 255 * 255 * 255。
          最后一個字節中存放的就是數據包的編號了,從0開始遞增。
          在標識位設置完畢之后,就可以把255 * 255 * 255大小的數據從我們準備好的待發送數據包中copy出來了,注意,前4位已經是標識位了,所以應該從第五個位置開始copy數據

           # packetToSend = compressPacket(headerPacket, HEADER_LENGTH,    
          #                 splitSize, HEADER_LENGTH); 

          LoadBalancingConnectionProxy
          package java.lang.reflect 。 proxy .


          http://developer.51cto.com/art/200907/137823.htm

          http://dev.mysql.com/doc/refman/5.1/en/connector-j-reference-implementation-notes.html

          PreparedStatements are implemented by the driver, as MySQL does not have a prepared statement feature. Because of this, the driver does not implement getParameterMetaData() or getMetaData() as it would require the driver to have a complete SQL parser in the client.

          Starting with version 3.1.0 MySQL Connector/J, server-side prepared statements and binary-encoded result sets are used when the server supports them.


          但這是不是說PreparedStatement沒用呢?不是的,PreparedStatement有其他的好處:
          1.代碼的可讀性和可維護性
          2.最重要的一點是極大地提高了安全性,可以防止SQL注入

          然后我又看了一些網上其他人的經驗,基本和我的判斷一致,有兩點要特別提請大家注意:

          1.并不是說PreparedStatement在所有的DB上都不會提高效率,PreparedStatement需要服務器端的支持,比如在 Oracle上就會有顯著效果。上面說的測試都是在MySQL上測試的,我找到了一個MySQL架構師的帖子,比較明確地說明了MySQL不支持 PreparedStatement。

          2.即便PreparedStatement不能提高性能,在少數使用時甚至會降低效率,但仍然應該使用PreparedStatement!因為其他好 處實在是太大了!當然,當SQL查詢比較復雜時,可能PreparedStatement好處會更大,只是我沒有測試,不敢肯定。

          3.既然PreparedStatement不能提高效率,那PreparedStatement Pool也就沒有必要了。但可以看到每次新建Connection的開銷實在很大,因此Connection Pool絕對必要。


          posted @ 2009-12-30 12:41 西津渡 閱讀(385) | 評論 (0)編輯 收藏
           
          download ,annatation and tools 兩個項目。
          添加相關的 jar.

          <taskdef name="hibernatetool" classname="org.hibernate.tool.ant.HibernateToolTask" classpathref="master.classpath" />

          <target name="create_table">

          <hibernatetool destdir="${script.dir}">
              <annotationconfiguration configurationfile="src/hibernate.cfg.xml" />
              <hbm2ddl export="false" create="true" delimiter=";" format="true" outputfilename="create-tables.sql" />
          </hibernatetool>

          </target>

          <!DOCTYPE hibernate-configuration PUBLIC
              "-//Hibernate/Hibernate Configuration DTD 3.0//EN"
              "http://hibernate.sourceforge.net/hibernate-configuration-3.0.dtd">

          <hibernate-configuration>
              <session-factory name="logi">
                  <property name="show_sql">true</property>
                  <mapping class="com.tt.logi.target.Target"/>
             
              </session-factory>
          </hibernate-configuration>

          import java.io.Serializable;

          import javax.persistence.Basic;
          import javax.persistence.Entity;
          import javax.persistence.Id;

          @Entity
          public class Target implements Serializable{
             
              private Long id;
              private String name;
              @Id
              public Long getId() {
                  return id;
              }
              public void setId(Long id) {
                  this.id = id;
              }
              @Basic
              public String getName() {
                  return name;
              }
              public void setName(String name) {
                  this.name = name;
              }


          posted @ 2009-12-14 19:04 西津渡 閱讀(101) | 評論 (0)編輯 收藏
           
          wget ftp://ftp.jaist.ac.jp/pub/mysql/Downloads/MySQL-5.1/mysql-5.1.41.tar.gz
          tar -xzf


          ./configure --prefix=/usr/local/mysql51m --without-debug  --enable-local-infile --enable-assembler --enable-thread-safe-client --with-plugins=all

          make
          su -
          make install


          groupadd mysql
          useradd -g mysql mysql


          bin/mysql_install_db --user=mysql  --datadir=/var/lib/mysql51m/data

          chown -R mysql /var/lib/mysql51m/
          chgrp -R mysql /var/lib/mysql51m/


          cp share/mysql/my-innodb-heavy-4G.cnf my.cnf
          vi my.cnf

          datadir = /var/lib/mysql51m/data

          .bin/mysqld_safe --defaults-file=/usr/local/mysql51m/my.cnf &

          bin/mysql  --defaults-file=my.cnf -uroot

          ./mysqladmin -u root password ‘humber’
          grant all on *.* to root@% identified by 'humber'

          default-character-set=utf8
          init_connect='SET NAMES utf8'
          default-storage-engine = INNODB

          posted @ 2009-12-14 14:44 西津渡 閱讀(118) | 評論 (0)編輯 收藏
           
          jmap -heap 16761
          jstat -gcutil 16761
          jmap -finalizerinfo 16761
          jmap -histo 16761
          jstack -l 16761
          jinfo 16761

          Examine the fatal error log file. Default file name is hs_err_pidpid.log in the working-directory.

          -XX:+HeapDumpOnOutOfMemoryError
          java -agentlib:hprof=heap=dump,format=b application
          $ jmap -dump:format=b,file=snapshot.jmap process-pid

          1、在jvm啟動時加上:-agentlib:hprof=heap=sites,file=heap.txt  ,然后執行一段時間后執行 kill -3 <pid>,就可以獲取jvm的內存鏡像。類似的通過-agentlib:hprof=cpu=samples,file=cpu.txt查 看cpu的狀況。

          http://java.sun.com/javase/6/webnotes/trouble/other/matrix6-Unix.html


          Quick Troubleshooting Tips on Solaris OS and Linux for Java SE 6

          This "Quick Start Guide" gives you some quick tips for troubleshooting. The subsections list some typical functions that can help you in troubleshooting, including one or more ways to get the information or perform the action.

          These tips are organized as follows:

          Hung, Deadlocked, or Looping Process
          Post-mortem Diagnostics, Memory Leaks
          Monitoring
          Actions on a Remote Debug Server
          Other Functions

          Hung, Deadlocked, or Looping Process

          • Print thread stack for all Java threads:
            • Control-"
            • kill -QUIT pid
            • jstack pid (or jstack -F pid if jstack pid does not respond)
          • Detect deadlocks:
            • Request deadlock detection: JConsole tool, Threads tab
            • Print information on deadlocked threads: Control-"
            • Print list of concurrent locks owned by each thread: -XX:+PrintConcurrentLocks set, then Control-"
            • Print lock information for a process: jstack -l pid
          • Get a heap histogram for a process:
            • Start Java process with -XX:+PrintClassHistogram, then Control-"
            • jmap -histo pid (with -F option if pid does not respond)
          • Dump Java heap for a process in binary format to file:
            • jmap -dump:format=b,file=filename pid (with -F option if pid does not respond)
          • Print shared object mappings for a process:
            • jmap pid
          • Print heap summary for a process:
            • Control-"
            • jmap -heap pid
          • Print finalization information for a process:
            • jmap -finalizerinfo pid
          • Attach the command-line debugger to a process:
            • jdb -connect sun.jvm.hotspot.jdi.SAPIDAttachingConnector:pid=pid

          Post-mortem Diagnostics, Memory Leaks

          • Examine the fatal error log file. Default file name is hs_err_pidpid.log in the working-directory.
          • Create a heap dump:
            • Start the application with HPROF enabled: java -agentlib:hprof=file=file,format=b application; then Control-"
            • Start the application with HPROF enabled: java -agentlib:hprof=heap=dump application
            • JConsole tool, MBeans tab
            • Start VM with -XX:+HeapDumpOnOutOfMemoryError; if OutOfMemoryError is thrown, VM generates a heap dump.
          • Browse Java heap dump:
            • jhat heap-dump-file
          • Dump Java heap from core file in binary format to a file:
            • jmap -dump:format=b,file=filename corefile
          • Get a heap histogram for a process:
            • Start Java process with -XX:+PrintClassHistogram, then Control-"
            • jmap -histo pid (with -F option if pid does not respond)
          • Get a heap histogram from a core file:
            • jmap -histo corefile
          • Print shared object mappings from a core file:
            • jmap corefile
          • Print heap summary from a core file:
            • jmap -heap corefile
          • Print finalization information from a core file:
            • jmap -finalizerinfo corefile
          • Print Java configuration information from a core file:
            • jinfo corefile
          • Print thread trace from a core file:
            • jstack corefile
          • Print lock information from a core file:
            • jstack -l corefile
          • Attach the command-line debugger to a core file on the same machine:
            • jdb -connect sun.jvm.hotspot.jdi.SACoreAttachingConnector:javaExecutable=path,core=corefile
          • Attach the command-line debugger to a core file on a different machine:
            • On the machine with the core file: jsadebugd path corefile
              and on the machine with the debugger: jdb -connect sun.jvm.hotspot.jdi.SADebugServerAttachingConnector:debugServerName=machine
          • libumem can be used to debug memory leaks.

          Monitoring

          Note: The vmID argument for the jstat command is the virtual machine identifier. See the jstat man page for a detailed explanation.

          • Print statistics on the class loader:
            • jstat -class vmID
          • Print statistics on the compiler:
            • Compiler behavior: jstat -compiler vmID
            • Compilation method statistics: jstat -printcompilation vmID
          • Print statistics on garbage collection:
            • Summary of statistics: jstat -gcutil vmID
            • Summary of statistics, with causes: jstat -gccause vmID
            • Behavior of the gc heap: jstat -gc vmID
            • Capacities of all the generations: jstat -gccapacity vmID
            • Behavior of the new generation: jstat -gcnew vmID
            • Capacity of the new generation: jstat -gcnewcapacity vmID
            • Behavior of the old and permanent generations: jstat -gcold vmID
            • Capacity of the old generation: jstat -gcoldcapacity vmID
            • Capacity of the permanent generation: jstat -gcpermcapacity vmID
          • Monitor objects awaiting finalization:
            • JConsole tool, VM Summary tab
            • jmap -finalizerinfo pid
            • getObjectPendingFinalizationCount method in java.lang.management.MemoryMXBean class
          • Monitor memory:
            • Heap allocation profiles via HPROF: java -agentlib:hprof=heap=sites
            • JConsole tool, Memory tab
            • Control-" prints generation information.
          • Monitor CPU usage:
            • By thread stack: java -agentlib:hprof=cpu=samples application
            • By method: java -agentlib:hprof=cpu=times application
            • JConsole tool, Overview and VM Summary tabs
          • Monitor thread activity:
            • JConsole tool, Threads tab
          • Monitor class activity:
            • JConsole tool, Classes tab

          Actions on a Remote Debug Server

          First, attach the debug daemon jsadebugd, then execute the command:

          • Dump Java heap in binary format to a file: jmap -dump:format=b,file=filename hostID
          • Print shared object mappings: jmap hostID
          • Print heap summary : jmap -heap hostID
          • Print finalization information : jmap -finalizerinfo hostID
          • Print lock information : jstack -l hostID
          • Print thread trace : jstack hostID
          • Print Java configuration information: jinfo hostID

          Other Functions

          • Interface with the instrumented Java virtual machines:
            • Monitor for the creation and termination of instrumented VMs: jstatd daemon
            • List the instrumented VMs: jps
            • Provide interface between remote monitoring tools and local VMs: jstatd daemon
            • Request garbage collection: JConsole tool, Memory tab
          • Print Java configuration information from a running process:
            • jinfo pid
          • Dynamically set, unset, or change the value of certain Java VM flags for a process:
            • jinfo -flag flag
          • Print command-line flags passed to the VM:
            • jinfo -flags
          • Print Java system properties:
            • jinfo -sysprops
          • Pass a Java VM flag to the virtual machine:
            • jconsole -Jflag ...
            • jhat -Jflag ...
            • jmap -Jflag ...
          • Print statistics of permanent generation of Java heap, by class loader:
            • jmap -permstat
          • Report on monitor contention.
            • java -agentlib:hprof=monitor=y application
          • Evaluate or execute a script in interactive or batch mode:
            • jrunscript
          • Interface dynamically with an MBean, via JConsole tool, MBean tab:
            • Show tree structure.
            • Set an attribute value.
            • Invoke an operation.
            • Subscribe to notification.
          • Run interactive command-line debugger:
            • Launch a new VM for the class: jdb class
            • Attach debugger to a running VM: jdb -attach address
            http://www.aygfsteel.com/justinchen/archive/2009/01/08/248738.html
          posted @ 2009-12-07 14:16 西津渡 閱讀(431) | 評論 (0)編輯 收藏
           
          netstat -n | awk '/^tcp/ {++state[$NF]} END {for(key in state) print key,""t",state[key]}'

          posted @ 2009-12-07 13:42 西津渡| 編輯 收藏
           
          主站蜘蛛池模板: 广元市| 太和县| 青铜峡市| 泽普县| 荣成市| 宝丰县| 南康市| 湘潭县| 汤阴县| 基隆市| 湟源县| 陆河县| 鄢陵县| 湖州市| 科技| 什邡市| 昆山市| 兴和县| 措美县| 常州市| 井研县| 淮安市| 南川市| 肃宁县| 光山县| 长治市| 嘉善县| 屯门区| 临猗县| 临海市| 修武县| 新丰县| 合水县| 原平市| 左云县| 芮城县| 阿尔山市| 陈巴尔虎旗| 建水县| 南雄市| 上虞市|