qileilove

          blog已經(jīng)轉(zhuǎn)移至github,大家請(qǐng)?jiān)L問(wèn) http://qaseven.github.io/

          jmeter對(duì)數(shù)據(jù)的測(cè)試

          Building a Database Test Plan

          In this section, you will learn how to create a basic Test Plan to test a database server. You will create ten users that send five SQL requests to the database server. Also, you will tell the users to run their tests three times. So, the total number of requests is (10 users) x (2 requests) x (repeat 3 times) = 60 JDBC requests. To construct the Test Plan, you will use the following elements: Thread Group , JDBC Request , Graph Results .

          This example uses the MySQL database driver. To use this driver, its containing .jar file must be copied to the JMeter lib directory (see JMeter's Classpath for more details).


          記住 mysql 與sqlserver 或者 oracle jar包
          都放在 lib目錄下

          Adding Users

          The first step you want to do with every JMeter Test Plan is to add a Thread Group element. The Thread Group tells JMeter the number of users you want to simulate, how often the users should send requests, and the how many requests they should send.

          Go ahead and add the ThreadGroup element by first selecting the Test Plan, clicking your right mouse button to get the Add menu, and then select Add --> ThreadGroup.

          You should now see the Thread Group element under Test Plan. If you do not see the element, then "expand" the Test Plan tree by clicking on the Test Plan element.

          Next, you need to modify the default properties. Select the Thread Group element in the tree, if you have not already selected it. You should now see the Thread Group Control Panel in the right section of the JMeter window (see Figure 7.1 below)


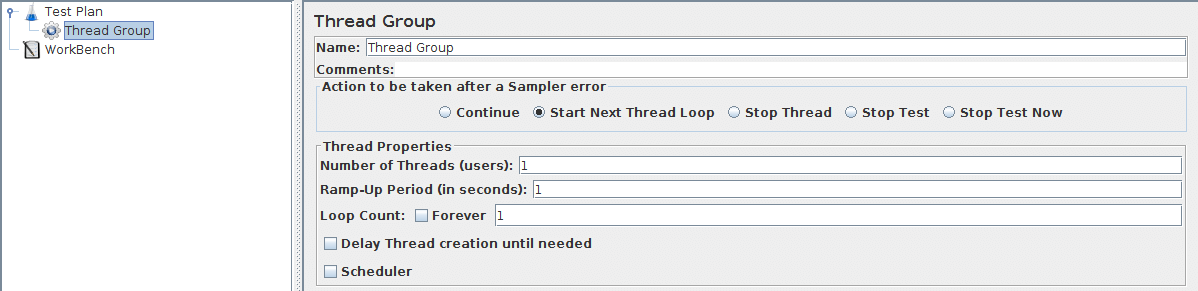
          Figure 7.1. Thread Group with Default Values

          Start by providing a more descriptive name for our Thread Group. In the name field, enter JDBC Users.

          You will need a valid database, database table, and user-level access to that table. In the example shown here, the database is 'mydb' and the table name is 'Stocks'.

          Next, increase the number of users to 10.

          In the next field, the Ramp-Up Period, leave the the default value of 0 seconds. This property tells JMeter how long to delay between starting each user. For example, if you enter a Ramp-Up Period of 5 seconds, JMeter will finish starting all of your users by the end of the 5 seconds. So, if we have 5 users and a 5 second Ramp-Up Period, then the delay between starting users would be 1 second (5 users / 5 seconds = 1 user per second). If you set the value to 0, then JMeter will immediately start all of your users.

          Finally, enter a value of 3 in the Loop Count field. This property tells JMeter how many times to repeat your test. To have JMeter repeatedly run your Test Plan, select the Forever checkbox.

          In most applications, you have to manually accept changes you make in a Control Panel. However, in JMeter, the Control Panel automatically accepts your changes as you make them. If you change the name of an element, the tree will be updated with the new text after you leave the Control Panel (for example, when selecting another tree element).

          See Figure 7.2 for the completed JDBC Users Thread Group.


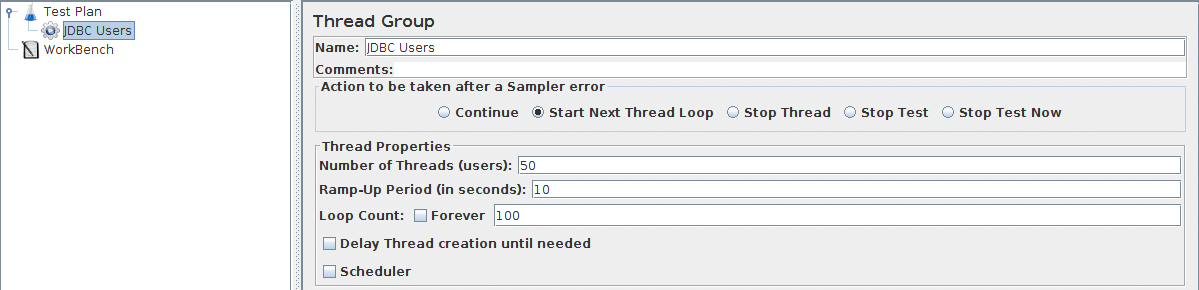
          Figure 7.2. JDBC Users Thread Group

          7.2 Adding JDBC Requests

          Now that we have defined our users, it is time to define the tasks that they will be performing. In this section, you will specify the JDBC requests to perform.

          Begin by selecting the JDBC Users element. Click your right mouse button to get the Add menu, and then select Add --> Config Element --> JDBC Connection Configuration. Then, select this new element to view its Control Panel (see Figure 7.3).

          Set up the following fields (these assume we will be using a local MySQL database called test):

          • Variable name bound to pool. This needs to uniquely identify the configuration. It is used by the JDBC Sampler to identify the configuration to be used.
          • Database URL: jdbc:mysql://localhost:3306/test
          • JDBC Driver class: com.mysql.jdbc.Driver
          • Username: guest
          • Password: password for guest

          The other fields on the screen can be left as the defaults.

          JMeter creates a database connection pool with the configuration settings as specified in the Control Panel. The pool is referred to in JDBC Requests in the 'Variable Name' field. Several different JDBC Configuration elements can be used, but they must have unique names. Every JDBC Request must refer to a JDBC Configuration pool. More than one JDBC Request can refer to the same pool.


          Figure 7.3. JDBC Configuration

          Selecting the JDBC Users element again. Click your right mouse button to get the Add menu, and then select Add --> Sampler --> JDBC Request. Then, select this new element to view its Control Panel (see Figure 7.4).


          Figure 7.4. JDBC Request

          In our Test Plan, we will make two JDBC requests. The first one is for Eastman Kodak stock, and the second is Pfizer stock (obviously you should change these to examples appropriate for your particular database). These are illustrated below.

          JMeter sends requests in the order that you add them to the tree.

          Start by editing the following properties (see Figure 7.5):

          • Change the Name to "Kodak".
          • Enter the Pool Name: MySQL (same as in the configuration element)
          • Enter the SQL Query String field.

          Figure 7.5. JDBC Request for Eastman Kodak stock

          Next, add the second JDBC Request and edit the following properties (see Figure 7.6):

          • Change the Name to "Pfizer".
          • Enter the SQL Query String field.

          Figure 7.6. JDBC Request for Pfizer stock

          7.3 Adding a Listener to View/Store the Test Results

          The final element you need to add to your Test Plan is a Listener . This element is responsible for storing all of the results of your JDBC requests in a file and presenting a visual model of the data.

          Select the JDBC Users element and add a Graph Results listener (Add --> Listener --> Graph Results).


          Figure 7.7. Graph results Listener

          posted on 2012-04-26 13:52 順其自然EVO 閱讀(1164) 評(píng)論(0)  編輯  收藏 所屬分類(lèi): jmeter and badboy

          <2012年4月>
          25262728293031
          1234567
          891011121314
          15161718192021
          22232425262728
          293012345

          導(dǎo)航

          統(tǒng)計(jì)

          常用鏈接

          留言簿(55)

          隨筆分類(lèi)

          隨筆檔案

          文章分類(lèi)

          文章檔案

          搜索

          最新評(píng)論

          閱讀排行榜

          評(píng)論排行榜

          主站蜘蛛池模板: 科技| 利辛县| 商南县| 丹巴县| 慈利县| 汝南县| 徐州市| 通渭县| 北流市| 北安市| 乡城县| 亚东县| 江津市| 加查县| 通河县| 进贤县| 商洛市| 黑山县| 肇东市| 栾城县| 司法| 乌海市| 曲阳县| 唐海县| 陵水| 阿坝| 滨州市| 青田县| 鲜城| 威信县| 芦溪县| 玉树县| 宁陵县| 武强县| 郓城县| 镇原县| 云梦县| 资中县| 永年县| 岱山县| 温宿县|