2 ) select * from v$session where v$session.USERNAME='SCOTT'; //find the trace session
3) exec dbms_system.set_sql_trace_in_session(25,6,true); //open the sql_trace for the session
session2 (scott)
4) select * from t;
session 1(sysbda)
5) exec dbms_system.set_sql_trace_in_session(25,6,false); //close the sql_trace
6) show parameter user_dump; //get the trace file path
session 3: OS,
7) cd /opt/oracle/diag/rdbms/orcl/orcl/trace
8) ll -t *.trc //get the last trc file
9) /opt/oracle/product/11.1.x/bin/tkprof /opt/oracle/diag/rdbms/orcl/orcl/trace/orcl_ora_7688.trc /opt/oracle/diag/rdbms/orcl/orcl/trace/
orcl_ora_7688.trc.txt
利用 SQL Access Advisor 改进模式设计
目的
本教�E�将向�?zh��n)�说明如何使�?SQL Access Advisor 改进模式设计�?
大约 40 分钟
本教�E�包括下列主题:(x��)
| 概述 | |
| 前提条�g | |
| 使用 SQL Access Advisor | |
| �ȝ�� |
查看屏幕截图
![]() ���鼠标置于此图标�?/font>可以加蝲和查看本教程的所有屏�q�截图�?�Q�警告:(x��)因�ؓ(f��)此操作会(x��)同时加蝲所有屏�q�截图,所以网速较慢时�Q�响应时间可能会(x��)比较�ѝ��)
���鼠标置于此图标�?/font>可以加蝲和查看本教程的所有屏�q�截图�?�Q�警告:(x��)因�ؓ(f��)此操作会(x��)同时加蝲所有屏�q�截图,所以网速较慢时�Q�响应时间可能会(x��)比较�ѝ��)
注:(x��)此外�Q��?zh��n)��q�可以在下列步骤中将鼠标攑֜�每个单独的图标上�Q�从而仅加蝲和查看与该步骤相关的屏幕截图。可以通过单击各个屏幕截图来将光���藏�?
定义相应的访问结构以优化 SQL 查询始终�?Oracle DBA 要考虑的问题。因此,�����册���一问题�Q��h们编写了许多技术文章和脚本�Q�还开发了不少高端工具。此外,随着分区和物化视图技术的发展�Q�确定访问结构变得愈加复杂。�ؓ(f��)解决�q�一非常重要的需求,Oracle 数据�?10g �?11g 引入�?SQL Access Advisor�Q�从而改�q�了可管理性�?/p>
SQL Access Advisor 通过�����要创建、删除或保留的烦引、物化视图、物化视图日志或分区来确定�ƈ帮助解决�?SQL 语句执行相关的性能问题。它可以通过 Database Control �q�行�Q�也可以通过命��o(h��)行���?PL/SQL �q�程�q�行�?/p>
前提条�g
开始本教程之前�Q��?zh��n)�应该�Q?
| 1. |
安装 Oracle 数据�?11g�?/p> |
|
| 2. |
下蝲 sqlaccadv.zip 文�g�q�将其解压羃到�?zh��n)�的工作目录(�?wkdir�Q�,然后��D��到�?zh��n)�的工作目录�?/p> |
|
SQL Access Advisor ���实际负载作�����入,Advisor 也可以通过模式获得假定的负载。然后,它会(x��)�����可提供更快执行�\径的讉K���l�构。它��h��以下优点�Q?/p>
- 无需掌握专业知识�?
- �Ҏ(gu��)��实际�ȝ��在基于成本的优化器中的规则做军_���?
- 与优化器�?Oracle 数据库增强同步�?
- 是一个涵�?SQL 讉K���Ҏ(gu��)��各个斚w��的单一���N���E�序�?
- 提供���单、用户友好的 GUI 向导�?
- 生成脚本来实施徏议�?
下面的例子说明了 SQL Access Advisor 可以提供的徏议的�c�d��。该例子�q����?SQL Performance Analyzer 证明 SQL Access Advisor 提供的徏议很好�?/p>
执行以下步骤�Q�了�?SQL Access Advisor 的用法:(x��)
| 1. |
在以 oracle 用户�w�䆾�q�接的终端会(x��)话中�Q�执�?sqlaccessadv_setup.sh 脚本。该脚本���生成本 OBE 中��用的所有必需的数据。尤其是�Q�它?y��u)��生成用于表�C����分析的负载的 SQL 调整工具集�?/p> ./sqlaccessadv_setup.sh
|
|
| 2. |
�?sh用户�w�䆾�Q�口�?sh�Q�连接到 Enterprise Manager Database Control。进�?Home ��面后,单击 Related Links 部分中的 Advisor Central 链接�?/p>
|
|
| 3. |
�?Advisor Central ��面中,单击 SQL Advisors 链接。然后在 SQL Advisors ��面中,单击 SQL Access Advisor 链接�?/p>
|
|
| 4. |
�?Initial Options ��面中,选择 Inherit Options from a previously saved Task or Template�Q�然后选择 SQLACCESS_WAREHOUSE 模板。完成以上操作后�Q�单�?Continue�?/p>
|
|
| 5. |
�?Workload Source ��面中,选择 Use an existing SQL Tuning Set �q�在 SQL Tuning Set 域中输入 SH.SQLSET_MY_SQLACCESS_WORKLOAD。该 SQL 调整工具集是以前生成的。它表示�(zh��n)�要分析的仓库负载。完成以上操作后�Q�单�?Continue�?/p>
|
|
| 6. |
�?Recommendation Options ��面中,���保已选择所有可能的讉K���l�构�q����择�?Comprehensive。完成以上操作后�Q�单�?Continue�?/p>
|
|
| 7. |
�?Schedule ��面�?Task Name 域中输入 MY_SQLACCESS_TASK。从提供的列表中选择�W�一个时区(单击火炬图标�Q�。完成以上操作后�Q�单�?Continue�?/p>
|
|
| 8. |
�?Review ��面中,单击 Submit�?/p>
|
|
| 9. |
�q�回 Advisor Central ��面�Q�单�?Refresh。完成以上操作后�Q�单�?Results 表中�?MY_SQLACCESS_TASK 链接。该��d��应处�?COMPLETED 状态�?/p>
|
|
| 10. |
�q�将转至 Results ��面。通过该页面,�(zh��n)�可以看到针对该负蝲实施 SQL Access Advisor �����的潜在好处。单�?Recommendation 子选项卡�?/p>
|
|
| 11. |
�?Recommendations 子页面中�Q��?zh��n)�可以查看�����的高�U�概�q�。基本上�Q�会(x��)�����负蝲生成所有可能的������c�d��。确保已选择所有徏议,单击 Recommendation Details 按钮。这����{�?Details ��面�Q��?zh��n)�可以在其中看到有��x��个徏议的更多详细信息�Q�以及该负蝲中受�q�些�����影响的相�?SQL 语句。单�?OK�?/p>
|
|
| 12. |
�q�回 Recommendations 子页面,单击 Schedule Implementation 按钮�?/p>
|
|
| 13. |
�?Schedule Implementation ��面中,昄���一个警告,表明该向��g���?x��)尝试实施其������Q�因为某些徏议是非常重要的更改,应由���理员认真查看。因此,单击 Show SQL 按钮查看�(zh��n)�可以用来实施所有徏议的脚本。事实上�Q��?zh��n)�已经创徏了该脚本�q�将在本 OBE 的稍后部分��用。查看了该脚本之后,单击 Done。返�?Schedule Implementation ��面�Q�单�?Cancel�?/p>
|
|
| 14. |
单击右上角的 Database 选项卡,然后单击 Software and Support 选项卡。进�?Software and Support ��面后,单击 SQL Performance Analyzer 链接。�?zh��n)�现在希望证明实施�����是有益处的�?/p>
|
|
| 15. |
�?SQL Performance Analyzer ��面中,单击 Guided Workflow 链接�?/p>
|
|
| 16. |
�?Guided Workflow ��面中,单击与第 1 步对应的行上�?Execute 图标。在 Create SQL Performance Analyzer Task 中,�?SQL Performance Analyzer Task �?Name 域中输入 MY_SPA_TASK。然后,�?SQL 调整工具集的 Name 域中输入 SH.SQLSET_MY_SQLACCESS_WORKLOAD。完成以上操作后�Q�单�?Create�?/p>
|
|
| 17. |
�q�回 Guided Workflow ��面�Q�单�ȝ�� 2 步的 Execute 图标。在 Create Replay Trial ��面�?Replay Trial Name 域中输入 MY_SQL_REPLAY_BEFORE�Q�确保选中 Trial environment established 复选框。然后,单击 Submit�?/p>
|
|
| 18. |
在终端会(x��)话中�Q�在 SQL*Plus 下以 sh用户�w�䆾�Q�口�?sh�Q�连接。在 SQL*Plus �?x��)话中,执�?implement.sql 脚本。该脚本是与 SQL Access Advisor �?x��)话先前生成的徏议对应的预创�����本�?/p> @implement.sql
|
|
| 19. |
�q�回 Guided Workflow Enterprise Manager ��面�Q�单��M���W?3 步相对应�?Execute 图标。在 Create Replay Trial ��面�?Replay Trial Name 域中输入 MY_SQL_REPLAY_AFTER。确保已选中 Trial environment established 复选框�Q�然后单�?Submit�?/p>
|
|
| 20. |
�q�回 Guided Workflow Enterprise Manager ��面�Q�单��M���W?4 步对应的 Execute 图标。在 Run Replay Trial Comparison ��面中,���保创徏一�?MY_SQL_REPLAY_BEFORE �?MY_SQL_REPLAY_AFTER 之间的比较。单�?Submit�?/p>
|
|
| 21. |
�q�回 Guided Workflow Enterprise Manager ��面�Q�单��M���W?5 步对应的 Execute 图标。在 SQL Performance Analyzer Task Result ��面上,�(zh��n)�可以清楚地看到�W�二�ơ试用较�W�一�ơ快得多�?/p>
|
|
在本教程中,�(zh��n)�学�?f��n)了如何使�?SQL Access Advisor�?/p>
The concept of SQL tuning sets, along with the
DBMS_SQLTUNE package to manipulate them, was introduced in Oracle 10g as part of the Automatic SQL Tuning functionality. Oracle 11g makes further use of SQL tuning sets with the SQL Performance Analyzer, which compares the performance of the statements in a tuning set before and after a database change. The database change can be as major or minor as you like, such as:- Database, operating system, or hardware upgrades.
- Database, operating system, or hardware configuration changes.
- Database initialization parameter changes.
- Schema changes, such as adding indexes or materialized views.
- Refreshing optimizer statistics.
- Creating or changing SQL profiles.
The SQL Performance Analyzer can be run manually using the
DBMS_SQLPA package or using Enterprise Manager. This article gives an overview of both methods.- Setting Up the Test
- Creating SQL Tuning Sets using the DBMS_SQLTUNE Package
- Running the SQL Performance Analyzer using the DBMS_SQLPA Package
- Creating SQL Tuning Sets using Enterprise Manager
- Running the SQL Performance Analyzer using Enterprise Manager
- Optimizer Upgrade Simulation
- Parameter Change
- Transferring SQL Tuning Sets
Setting Up the Test
The SQL performance analyzer requires SQL tuning sets, and SQL tuning sets are pointless unless they contain SQL, so the first task should be to issue some SQL statements. We are only trying to demonstrate the technology, so the example can be really simple. The following code creates a test user calledSPA_TEST_USER.Next, connect to the test user and create a test table calledCONN sys/password@prod AS SYSDBA CREATE USER spa_test_user IDENTIFIED BY spa_test_user QUOTA UNLIMITED ON users; GRANT CONNECT, CREATE TABLE TO spa_test_user;
MY_OBJECTS using a query from the ALL_OBJECTS view.This schema represents our "before" state. Still logged in as the test user, issue the following statements.CONN spa_test_user/spa_test_user@prod CREATE TABLE my_objects AS SELECT * FROM all_objects; EXEC DBMS_STATS.gather_table_stats(USER, 'MY_OBJECTS', cascade => TRUE);
Notice, all statements make reference to the currently unindexedSELECT COUNT(*) FROM my_objects WHERE object_id <= 100; SELECT object_name FROM my_objects WHERE object_id = 100; SELECT COUNT(*) FROM my_objects WHERE object_id <= 1000; SELECT object_name FROM my_objects WHERE object_id = 1000; SELECT COUNT(*) FROM my_objects WHERE object_id BETWEEN 100 AND 1000;
OBJECT_ID column. Later we will be indexing this column to create our changed "after" state.The select statements are now in the shared pool, so we can start creating an SQL tuning set.
Creating SQL Tuning Sets using the DBMS_SQLTUNE Package
TheDBMS_SQLTUNE package contains procedures and functions that allow us to create, manipulate and drop SQL tuning sets. The first step is to create an SQL tuning set called spa_test_sqlset using the CREATE_SQLSET procedure.Next, theCONN sys/password@prod AS SYSDBA EXEC DBMS_SQLTUNE.create_sqlset(sqlset_name => 'spa_test_sqlset');
SELECT_CURSOR_CACHE table function is used to retrieve a cursor containing all SQL statements that were parsed by the SPA_TEST_USER schema and contain the word "my_objects". The resulting cursor is loaded into the tuning set using the LOAD_SQLSET procedure.TheDECLARE l_cursor DBMS_SQLTUNE.sqlset_cursor; BEGIN OPEN l_cursor FOR SELECT VALUE(a) FROM TABLE( DBMS_SQLTUNE.select_cursor_cache( basic_filter => 'sql_text LIKE ''%my_objects%'' and parsing_schema_name = ''SPA_TEST_USER''', attribute_list => 'ALL') ) a; DBMS_SQLTUNE.load_sqlset(sqlset_name => 'spa_test_sqlset', populate_cursor => l_cursor); END; /
DBA_SQLSET_STATEMENTS view allows us to see which statements have been associated with the tuning set.Now we have an SQL tuning set, we can start using the SQL performance analyzer.SELECT sql_text FROM dba_sqlset_statements WHERE sqlset_name = 'spa_test_sqlset'; SQL_TEXT -------------------------------------------------------------------------------- SELECT object_name FROM my_objects WHERE object_id = 100 SELECT COUNT(*) FROM my_objects WHERE object_id <= 100 SELECT COUNT(*) FROM my_objects WHERE object_id BETWEEN 100 AND 1000 SELECT COUNT(*) FROM my_objects WHERE object_id <= 1000 SELECT object_name FROM my_objects WHERE object_id = 1000 5 rows selected. SQL>
Running the SQL Performance Analyzer using the DBMS_SQLPA Package
TheDBMS_SQLPA package is the PL/SQL API used to manage the SQL performance ananlyzer. The first step is to create an analysis task using the CREATE_ANALYSIS_TASK function, passing in the SQL tuning set name and making a note of the resulting task name.Next, use theCONN sys/password@prod AS SYSDBA VARIABLE v_task VARCHAR2(64); EXEC :v_task := DBMS_SQLPA.create_analysis_task(sqlset_name => 'spa_test_sqlset'); PL/SQL procedure successfully completed. SQL> PRINT :v_task V_TASK -------------------------------------------------------------------------------- TASK_122 SQL>
EXECUTE_ANALYSIS_TASK procedure to execute the contents of the SQL tuning set against the current state of the database to gather information about the performance before any modifications are made. This analysis run is named before_change.Now we have the "before" performance information, we need to make a change so we can test the "after" performance. For this example we will simply add an index to the test table on theBEGIN DBMS_SQLPA.execute_analysis_task( task_name => :v_task, execution_type => 'test execute', execution_name => 'before_change'); END; /
OBJECT_ID column. In a new SQL*Plus session create the index using the following statements.Now, we can return to our original session and test the performance after the database change. Once again use theCONN spa_test_user/spa_test_user@prod CREATE INDEX my_objects_index_01 ON my_objects(object_id); EXEC DBMS_STATS.gather_table_stats(USER, 'MY_OBJECTS', cascade => TRUE);
EXECUTE_ANALYSIS_TASK procedure, naming the analysis task "after_change".Once the before and after analysis tasks are complete, we must run a comparison analysis task. The following code explicitly names the analysis tasks to compare using name-value pairs in theBEGIN DBMS_SQLPA.execute_analysis_task( task_name => :v_task, execution_type => 'test execute', execution_name => 'after_change'); END; /
EXECUTION_PARAMS parameter. If this is ommited, the latest two analysis runs are compared.With this final analysis run complete, we can check out the comparison report using theBEGIN DBMS_SQLPA.execute_analysis_task( task_name => :v_task, execution_type => 'compare performance', execution_params => dbms_advisor.arglist( 'execution_name1', 'before_change', 'execution_name2', 'after_change') ); END; /
REPORT_ANALYSIS_TASK function. The function returns a CLOB containing the report in text or HTML format. The script below spools the default text format report out to a file.An example of this file can be seen here.SET LONG 1000000 SET PAGESIZE 0 SET LINESIZE 200 SET LONGCHUNKSIZE 200 SET TRIMSPOOL ON SPOOL /tmp/execute_comparison_report.txt SELECT DBMS_SQLPA.report_analysis_task(:v_task) FROM dual; SPOOL OFF
Creating SQL Tuning Sets using Enterprise Manager
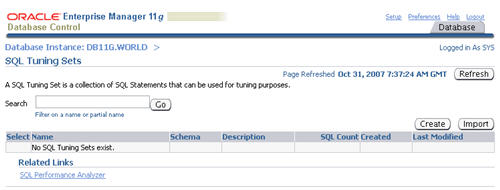
Click on the "SQL Tuning Sets" link towards the bottom of the "Performance" tab.
On the "SQL Tuning Sets" screen, click the "Create" button.
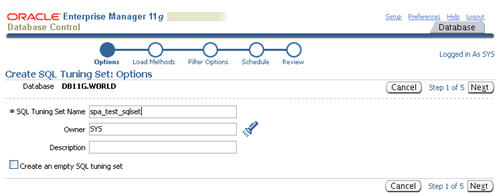
Enter a name for the SQL tuning set and click the "Next" button.
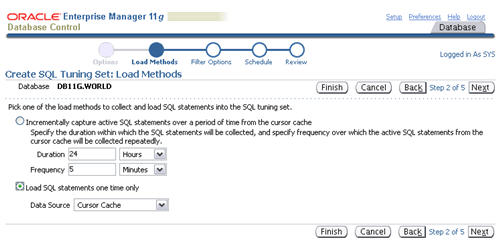
Select the "Load SQL statements one time only" option, select the "Cursor Cache" as the data source, then click the "Next" button.
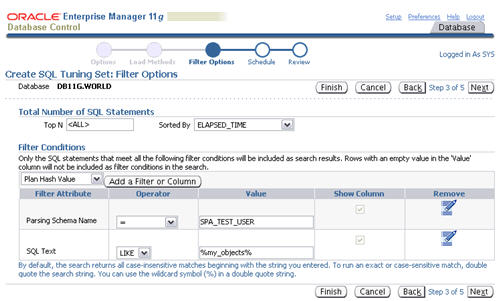
Set the appropriate values for the "Parsing Schema Name" and "SQL Text" filter attributes, remove any extra attributes by clicking their remove icons, then click the "Next" button.
Accept the immediate schedule by clicking the "Next" button.
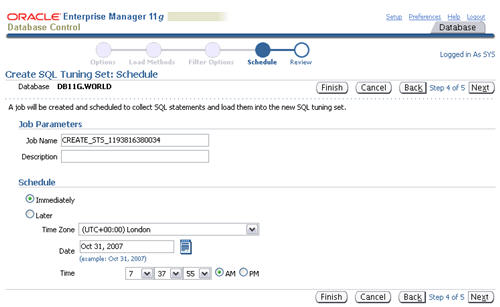
Assuming the review information looks correct, click the "Submit" button.
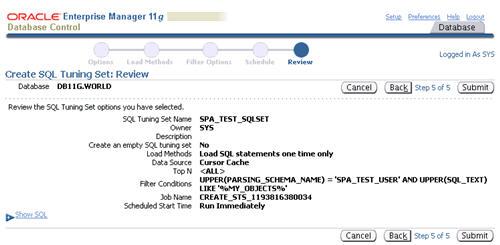
The "SQL Tuning Sets" screen shows the confirmation of the tuning set creation and the scheduled job to populate it.
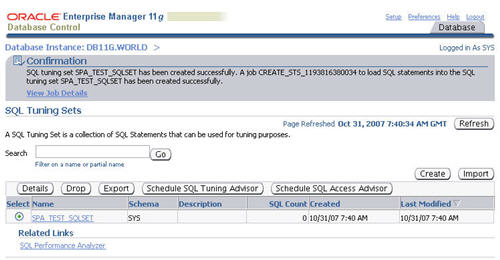
Once the population job completes, clicking on the SQL tuning set displays its contents.
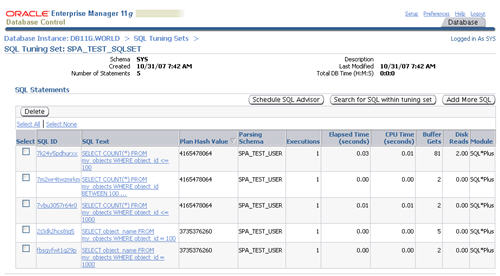
Now we have an SQL tuning set, we can start using the SQL performance analyzer.
Running the SQL Performance Analyzer using Enterprise Manager
Click the "SQL Performance Analayzer" link on the "Software and Support" tab.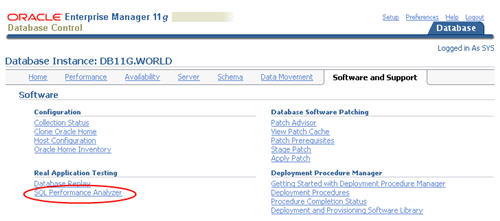
Click the "Guided Workflow" link on the "SQL Performance Analayzer" screen.
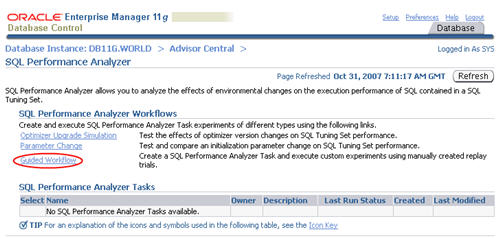
Click the execute icon on the first step to create the SQL Performance Analyzer task.
Enter a name for the SPA task, select the SQL tuning set to associate with it, then click the "Create" button.
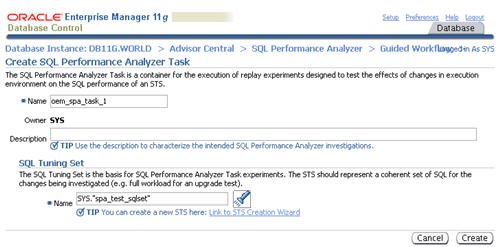
When the status of the previous step becomes a green tick, click the execute icon on the second step to capture the SQL tuning set performance information of the "before" state.
Enter a "Replay Trial Name" of "before_change", check the "Trial environment established" checkbox, then click the "Submit" button.
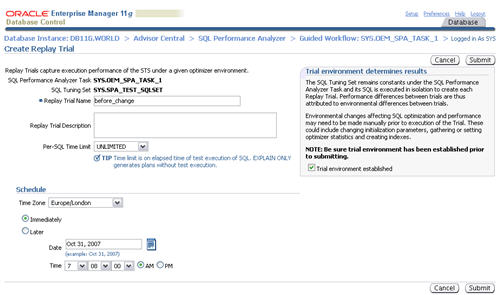
When the status of the previous step becomes a green tick, click the execute icon on the third step to capture the SQL tuning set performance information of the "after" state.
Alter the state of the database by creating an index on the
OBJECT_ID column of the test table.Enter a "Replay Trial Name" of "after_change", check the "Trial environment established" checkbox, then click the "Submit" button.CONN spa_test_user/spa_test_user@prod CREATE INDEX my_objects_index_01 ON my_objects(object_id); EXEC DBMS_STATS.gather_table_stats(USER, 'MY_OBJECTS', cascade => TRUE);
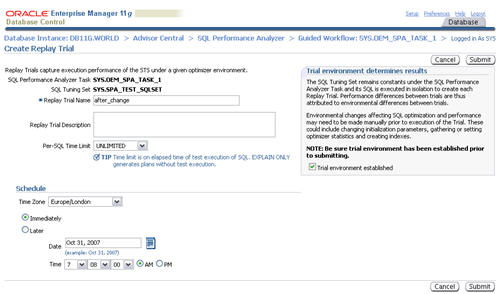
When the status of the previous step becomes a green tick, click the execute icon on the forth step to run a comparison analysis task.
Accept the default "Trial 1 Name" and "Trial 2 Name" settings by clicking the "Submit" button.
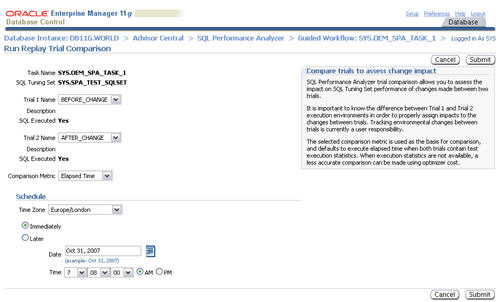
When the status of the previous step becomes a green tick, click the execute icon on the fifth step to view the comparison report.
The resulting page contains the comparison report for the SQL Performance Analyzer task.
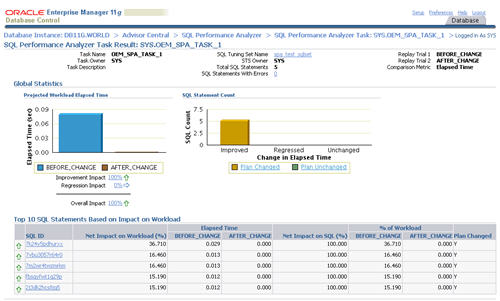
Clicking on a specific SQL ID displays the statement specific results, along with the before and after execution plans.
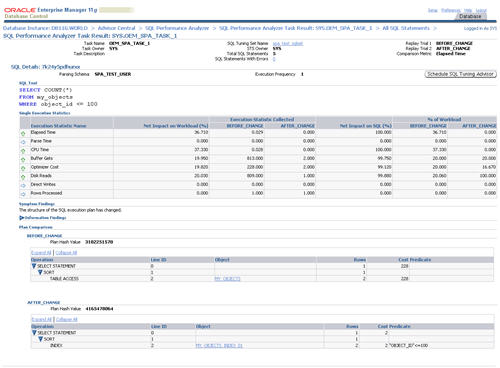
Optimizer Upgrade Simulation
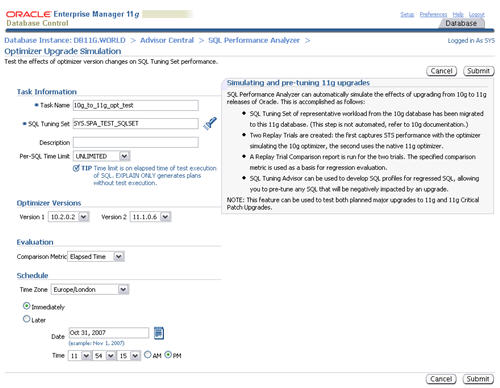
The SQL Performance Analyzer allows you to test the affects of optimizer version changes on SQL tuning sets. Click the "Optimizer Upgrade Simulation" link on the "SQL Performance Analyzer" page.
Enter a task name, select the two optimizer versions to compare, then click the "Submit" button.
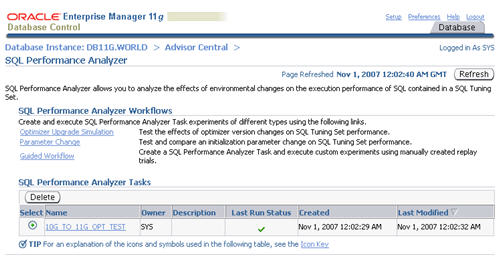
The task is listed in the "SQL Performance Analyzer Tasks" section. Refresh the page intermittently until the task status becomes a green tick, then click on the task name.
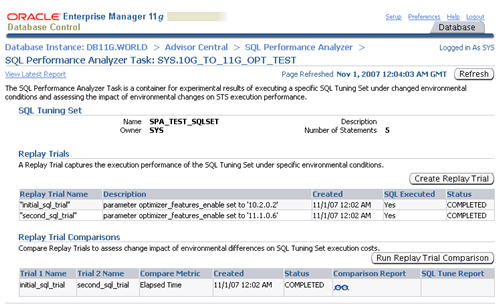
The resulting screen shows details of the selected task. Click on the "Comparison Report" classes icon allows you to view the comparison report.
Parameter Change
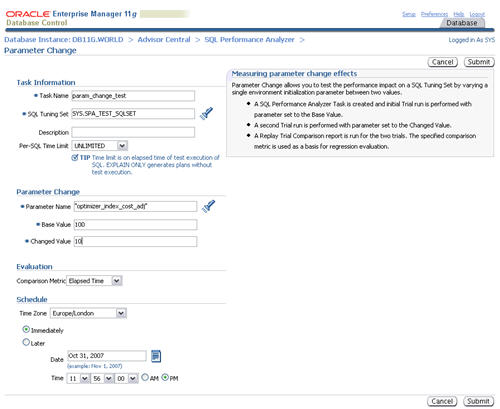
The SQL Performance Analyzer provides a shortcut for setting up tests of initialization parameter changes on SQL tuning sets. Click the "Parameter" link on the "SQL Performance Analyzer" page.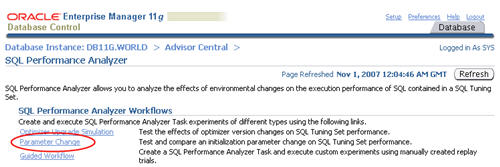
Enter a task name and the parameter you wish to test. Enter the base and changed value, then click the "Submit" button.
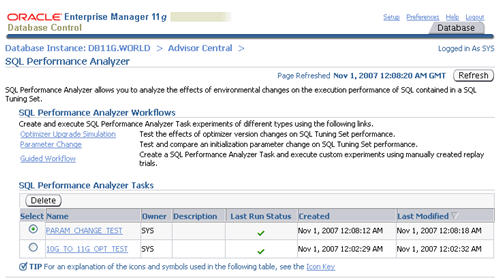
The task is listed in the "SQL Performance Analyzer Tasks" section. Refresh the page intermittently until the task status becomes a green tick, then click on the task name.
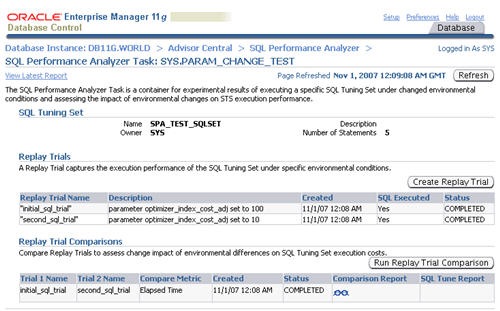
The resulting screen shows details of the selected task. Click on the "Comparison Report" classes icon allows you to view the comparison report.
Transferring SQL Tuning Sets
In the examples listed above, the tests have been performed on the same system. In reality you are more likely to want to create a tuning set on your production system, then run the SQL Performance Analyzer against it on a test system. Fortunately, theDBMS_SQLTUNE package allows you to transport SQL tuning sets by storing them in a staging table.First, create the staging table using the
CREATE_STGTAB_SQLSET procedure.Next, use theCONN sys/password@prod AS SYSDBA BEGIN DBMS_SQLTUNE.create_stgtab_sqlset(table_name => 'SQLSET_TAB', schema_name => 'SPA_TEST_USER', tablespace_name => 'USERS'); END; /
PACK_STGTAB_SQLSET procedure to export SQL tuning set into the staging table.Once the SQL tuning set is packed into the staging table, the table can be transferred to the test system using Datapump, Export/Import or via a database link. Once on the test system, the SQL tuning set can be imported using theBEGIN DBMS_SQLTUNE.pack_stgtab_sqlset(sqlset_name => 'SPA_TEST_SQLSET', sqlset_owner => 'SYS', staging_table_name => 'SQLSET_TAB', staging_schema_owner => 'SPA_TEST_USER'); END; /
UNPACK_STGTAB_SQLSET procedure.The SQL tuning set can now be used with the SQL Performance Analyzer on the test system.BEGIN DBMS_SQLTUNE.unpack_stgtab_sqlset(sqlset_name => '%', sqlset_owner => 'SYS', replace => TRUE, staging_table_name => 'SQLSET_TAB', staging_schema_owner => 'SPA_TEST_USER'); END; /
For more information see:
2)
drop user SYSMAN cascade;

drop user MGMT_VIEW cascade;

drop role MGMT_USER;

drop public synonym MGMT_TARGET_BLACKOUTS;

drop public synonym SETEMVIEWUSERCONTEXT;
drop user sysman cascade;

drop public synonym MGMT_ADMIN;

drop public synonym MGMT_AS_ECM_UTIL;

drop public synonym MGMT_AVAILABILITY;

drop public synonym MGMT_COLLECTION_PROPERTIES;

drop public synonym MGMT_CREDENTIAL;

drop public synonym MGMT_CURRENT_AVAILABILITY;

drop public synonym MGMT_CURRENT_METRICS;

drop public synonym MGMT_CURRENT_METRIC_ERRORS;

drop public synonym MGMT_CURRENT_SEVERITY;

drop public synonym MGMT_DELTA;

drop public synonym MGMT_DELTA_ENTRY;

drop public synonym MGMT_DELTA_ENTRY_VALUES;

drop public synonym MGMT_DELTA_IDS;

drop public synonym MGMT_DELTA_ID_VALUES;

drop public synonym MGMT_DELTA_VALUE;

drop public synonym MGMT_DELTA_VALUES;

drop public synonym MGMT_GLOBAL;

drop public synonym MGMT_GUID_ARRAY;

drop public synonym MGMT_GUID_OBJ;

drop public synonym MGMT_IP_TGT_GUID_ARRAY;

drop public synonym MGMT_JOB;

drop public synonym MGMT_JOBS;

drop public synonym MGMT_JOB_EXECPLAN;

drop public synonym MGMT_JOB_EXECUTION;

drop public synonym MGMT_JOB_EXEC_SUMMARY;

drop public synonym MGMT_JOB_OUTPUT;

drop public synonym MGMT_JOB_PARAMETER;

drop public synonym MGMT_JOB_SCHEDULE;

drop public synonym MGMT_JOB_TARGET;

drop public synonym MGMT_LOG;

drop public synonym MGMT_LONG_TEXT;

drop public synonym MGMT_MESSAGES;

drop public synonym MGMT_METRICS;drop public synonym MGMT_METRICS_1DAY;

drop public synonym MGMT_METRICS_1HOUR;

drop public synonym MGMT_METRICS_COMPOSITE_KEYS;

drop public synonym MGMT_METRICS_RAW;

drop public synonym MGMT_METRIC_COLLECTIONS;

drop public synonym MGMT_METRIC_ERRORS;

drop public synonym MGMT_METRIC_THRESHOLDS;

drop public synonym MGMT_NAME_VALUE;

drop public synonym MGMT_NAME_VALUES;

drop public synonym MGMT_PREFERENCES;

drop public synonym MGMT_SEVERITY;

drop public synonym MGMT_SEVERITY_ARRAY;

drop public synonym MGMT_SEVERITY_OBJ;

drop public synonym MGMT_STRING_METRIC_HISTORY;

drop public synonym MGMT_TARGET;

drop public synonym MGMT_TARGETS;

drop public synonym MGMT_TARGET_BLACKOUTS;

drop public synonym MGMT_TARGET_MEMBERSHIPS;

drop public synonym MGMT_TARGET_PROPERTIES;

drop public synonym MGMT_TYPE_PROPERTIES;

drop public synonym MGMT_USER;

drop public synonym MGMT_VIEW_UTIL;

drop public synonym MGMT$DELTA_ORACLE_HOME;

drop public synonym MGMT$DELTA_OS_COMPONENTS;

drop public synonym MGMT$DELTA_OS_COMP_DETAILS;

drop public synonym MGMT$DELTA_OS_KERNEL_PARAMS;

drop public synonym MGMT$DELTA_PATCHSETS;

drop public synonym MGMT$DELTA_PATCHSET_DETAILS;

drop public synonym MGMT$DELTA_TABLESPACES;

drop public synonym MGMT$DELTA_VENDOR_SW;

drop public synonym MGMT$DELTA_VIEW;

drop public synonym MGMT$DELTA_VIEW_DETAILS;

drop public synonym MGMT$ECM_CURRENT_SNAPSHOTS;

drop public synonym MGMT$ECM_VISIBLE_SNAPSHOTS;

drop public synonym MGMT$GROUP_DERIVED_MEMBERSHIPS;

drop public synonym MGMT$GROUP_FLAT_MEMBERSHIPS;

drop public synonym MGMT$GROUP_MEMBERS;

drop public synonym MGMT$HA_BACKUP;

drop public synonym MGMT$HA_FILES;

drop public synonym MGMT$HA_INFO;

drop public synonym MGMT$HA_INIT_PARAMS;

drop public synonym MGMT$HA_MTTR;

drop public synonym MGMT$HA_RMAN_CONFIG;

drop public synonym MGMT$HW_NIC;

drop public synonym MGMT$METRIC_COLLECTION;

drop public synonym MGMT$METRIC_CURRENT;

drop public synonym MGMT$METRIC_DAILY;

drop public synonym MGMT$METRIC_DETAILS;

drop public synonym MGMT$METRIC_HOURLY;

drop public synonym MGMT$MISSING_TARGETS;

drop public synonym MGMT$MISSING_TARGETS_IN_GROUPS;

drop public synonym MGMT$OS_COMPONENTS;

drop public synonym MGMT$OS_FS_MOUNT;

drop public synonym MGMT$OS_HW_SUMMARY;

drop public synonym MGMT$OS_KERNEL_PARAMS;

drop public synonym MGMT$OS_PATCHES;

drop public synonym MGMT$OS_SUMMARY;

drop public synonym MGMT$SOFTWARE_COMPONENTS;

drop public synonym MGMT$SOFTWARE_COMPONENT_ONEOFF;

drop public synonym MGMT$SOFTWARE_COMP_PATCHSET;

drop public synonym MGMT$SOFTWARE_DEPENDENCIES;

drop public synonym MGMT$SOFTWARE_HOMES;

drop public synonym MGMT$SOFTWARE_ONEOFF_PATCHES;

drop public synonym MGMT$SOFTWARE_OTHERS;

drop public synonym MGMT$SOFTWARE_PATCHES_IN_HOMES;

drop public synonym MGMT$SOFTWARE_PATCHSETS;

drop public synonym MGMT$TARGET;

drop public synonym MGMT$TARGET_COMPONENTS;

drop public synonym MGMT$TARGET_COMPOSITE;

drop public synonym MGMT$TARGET_PROPERTIES;

drop public synonym MGMT$TARGET_TYPE;

drop PUBLIC SYNONYM SMP_EMD_AVAIL_OBJ;

drop public synonym EMD_MNTR;

drop public synonym SMP_EMD_AVAIL_OBJ;

drop public synonym SMP_EMD_DELETE_REC_ARRAY;

drop public synonym SMP_EMD_INTEGER_ARRAY;

drop public synonym SMP_EMD_INTEGER_ARRAY_ARRAY;

drop public synonym SMP_EMD_NVPAIR;

drop public synonym SMP_EMD_NVPAIR_ARRAY;

drop public synonym SMP_EMD_STRING_ARRAY;

drop public synonym SMP_EMD_STRING_ARRAY_ARRAY;

drop public synonym SMP_EMD_TARGET_OBJ;

drop public synonym SMP_EMD_TARGET_OBJ_ARRAY;

drop public synonym ECM_UTIL;

drop role mgmt_user;


DROP USER sysman CASCADE;

DROP USER mgmt_view CASCADE;

DROP ROLE MGMT_USER;

ALTER USER dbsnmp ACCOUNT UNLOCK;

ALTER USER dbsnmp identified by dbsnmp;

DROP PUBLIC SYNONYM SETEMVIEWUSERCONTEXT;

DROP PUBLIC SYNONYM MGMT_TARGET_BLACKOUTS;

DROP PUBLIC SYNONYM MGMT_AVAILABILITY;

DROP PUBLIC SYNONYM MGMT_CURRENT_AVAILABILITY;

DROP PUBLIC SYNONYM MGMT_SEVERITY_OBJ;

DROP PUBLIC SYNONYM MGMT_SEVERITY_ARRAY;

DROP PUBLIC SYNONYM MGMT_GUID_OBJ;

DROP PUBLIC SYNONYM MGMT_GUID_ARRAY;

DROP PUBLIC SYNONYM SMP_EMD_AVAIL_OBJ;

DROP PUBLIC SYNONYM SMP_EMD_TARGET_OBJ;

DROP PUBLIC SYNONYM SMP_EMD_TARGET_OBJ_ARRAY;

DROP PUBLIC SYNONYM SMP_EMD_DELETE_REC_ARRAY;

DROP PUBLIC SYNONYM MGMT_METRICS;

DROP PUBLIC SYNONYM MGMT_TARGETS;

DROP PUBLIC SYNONYM MGMT_TYPE_PROPERTIES;

DROP PUBLIC SYNONYM MGMT_TARGET_PROPERTIES;

DROP PUBLIC SYNONYM MGMT_METRICS_RAW;

DROP PUBLIC SYNONYM MGMT_CURRENT_METRICS;

DROP PUBLIC SYNONYM MGMT_STRING_METRIC_HISTORY;

DROP PUBLIC SYNONYM MGMT_LONG_TEXT;

DROP PUBLIC SYNONYM MGMT_METRICS_COMPOSITE_KEYS;

DROP PUBLIC SYNONYM MGMT_METRICS_1HOUR;

DROP PUBLIC SYNONYM MGMT_METRICS_1DAY;

DROP PUBLIC SYNONYM MGMT_METRIC_ERRORS;

DROP PUBLIC SYNONYM MGMT_CURRENT_METRIC_ERRORS;

DROP PUBLIC SYNONYM EMD_MNTR;

DROP PUBLIC SYNONYM MGMT_METRIC_COLLECTIONS;

DROP PUBLIC SYNONYM MGMT_COLLECTION_PROPERTIES ;

DROP PUBLIC SYNONYM MGMT_METRIC_THRESHOLDS;

DROP PUBLIC SYNONYM SMP_EMD_NVPAIR;

DROP PUBLIC SYNONYM SMP_EMD_NVPAIR_ARRAY;

DROP PUBLIC SYNONYM SMP_EMD_STRING_ARRAY;

DROP PUBLIC SYNONYM SMP_EMD_STRING_ARRAY_ARRAY;

DROP PUBLIC SYNONYM SMP_EMD_INTEGER_ARRAY;

DROP PUBLIC SYNONYM SMP_EMD_INTEGER_ARRAY_ARRAY;

DROP PUBLIC SYNONYM MGMT_DELTA_IDS;

DROP PUBLIC SYNONYM MGMT_DELTA_ID_VALUES;

DROP PUBLIC SYNONYM MGMT_DELTA_ENTRY;

DROP PUBLIC SYNONYM MGMT_DELTA_ENTRY_VALUES;

DROP PUBLIC SYNONYM MGMT_DELTA_VALUE;

DROP PUBLIC SYNONYM MGMT_DELTA_VALUES;

DROP PUBLIC SYNONYM MGMT_NAME_VALUE;

DROP PUBLIC SYNONYM MGMT_NAME_VALUES;

DROP PUBLIC SYNONYM ECM_UTIL;
DROP PUBLIC SYNONYM MGMT_DELTA;

DROP PUBLIC SYNONYM MGMT_TARGET_MEMBERSHIPS;

DROP PUBLIC SYNONYM MGMT_JOB;

DROP PUBLIC SYNONYM MGMT_JOB_PARAMETER;

DROP PUBLIC SYNONYM MGMT_JOB_TARGET;

DROP PUBLIC SYNONYM MGMT_JOB_SCHEDULE;

DROP PUBLIC SYNONYM MGMT_JOB_EXECPLAN;

DROP PUBLIC SYNONYM MGMT_JOB_EXEC_SUMMARY;

DROP PUBLIC SYNONYM MGMT_JOB_OUTPUT;

DROP PUBLIC SYNONYM MGMT_JOB_EXECUTION;

DROP PUBLIC SYNONYM MGMT_LOG;

DROP PUBLIC SYNONYM MGMT_ADMIN;

DROP PUBLIC SYNONYM MGMT_GLOBAL;

DROP PUBLIC SYNONYM MGMT_TARGET;

DROP PUBLIC SYNONYM MGMT_CREDENTIAL;

DROP PUBLIC SYNONYM MGMT_JOBS;

DROP PUBLIC SYNONYM MGMT_PREFERENCES;

DROP PUBLIC SYNONYM MGMT_USER;

DROP PUBLIC SYNONYM MGMT_SEVERITY;

DROP PUBLIC SYNONYM MGMT_CURRENT_SEVERITY;

DROP PUBLIC SYNONYM MGMT_PAF_PROCS_LATEST;

DROP PUBLIC SYNONYM MGMT_PAF_JOBS;

DROP PUBLIC SYNONYM MGMT_PAF$PROCEDURES;

DROP PUBLIC SYNONYM MGMT_PAF$INSTANCES;

DROP PUBLIC SYNONYM MGMT_PAF$STATES;

DROP PUBLIC SYNONYM MGMT_PAF$APPLICATIONS;

DROP PUBLIC SYNONYM MGMT_VIEW_UTIL;

DROP PUBLIC SYNONYM MGMT_MESSAGES;
3)create:

Command: emca -config dbcontrol db -repos create启动实例不装载数据库�Q�STARTUP NOMOUNT
在下面的��d��中必��装载数据库而不用打开数据�?br /> �?重命名数据文�?br /> �?��d��取消或重命名重做日志文�g
�?允许和禁止重做日志存档选项
�?执行完整的数据库恢复操作
启动实例�q�装载数据库�Q�STARTUP MOUNT
当需要完成以下一�U��Q务时使用�q�种数据库启动模式:(x��)
�?执行数据库数据的导出或导入操�?br /> �?执行数据装蝲操作用SQL*Loader
�?暂时��L��一般的用户使用数据
�?在某个移植过�E�和升��操作�q�程�?br />
为实例装载数据库�Q�ALTER DATABASE MOUNT
打开一个关闭的数据库:(x��)ALTER DATABASE OPEN
以只��L��式打开数据库:(x��)ALTER DATABASE OPEN READ ONLY;


